Mapped: Global Wealth by Region (2023-2028F)
Did you know that 90% of wealth is held in just three of the world’s regions?
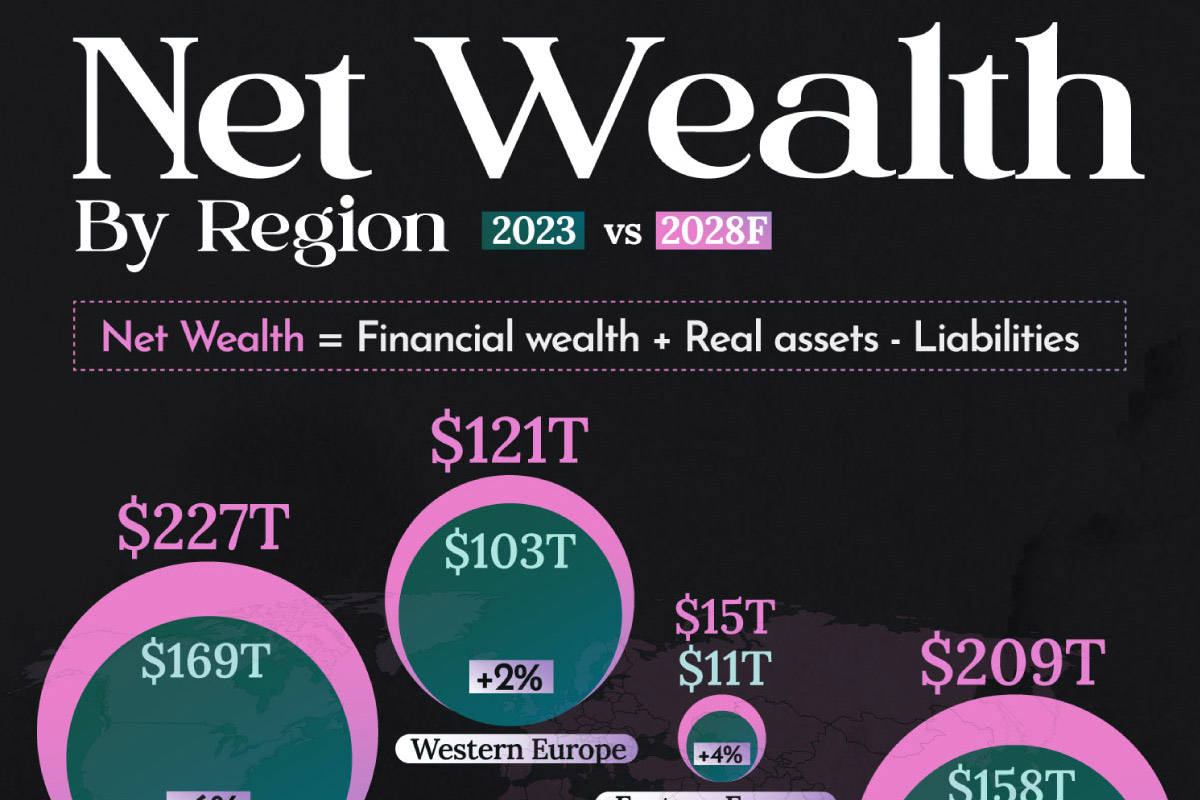
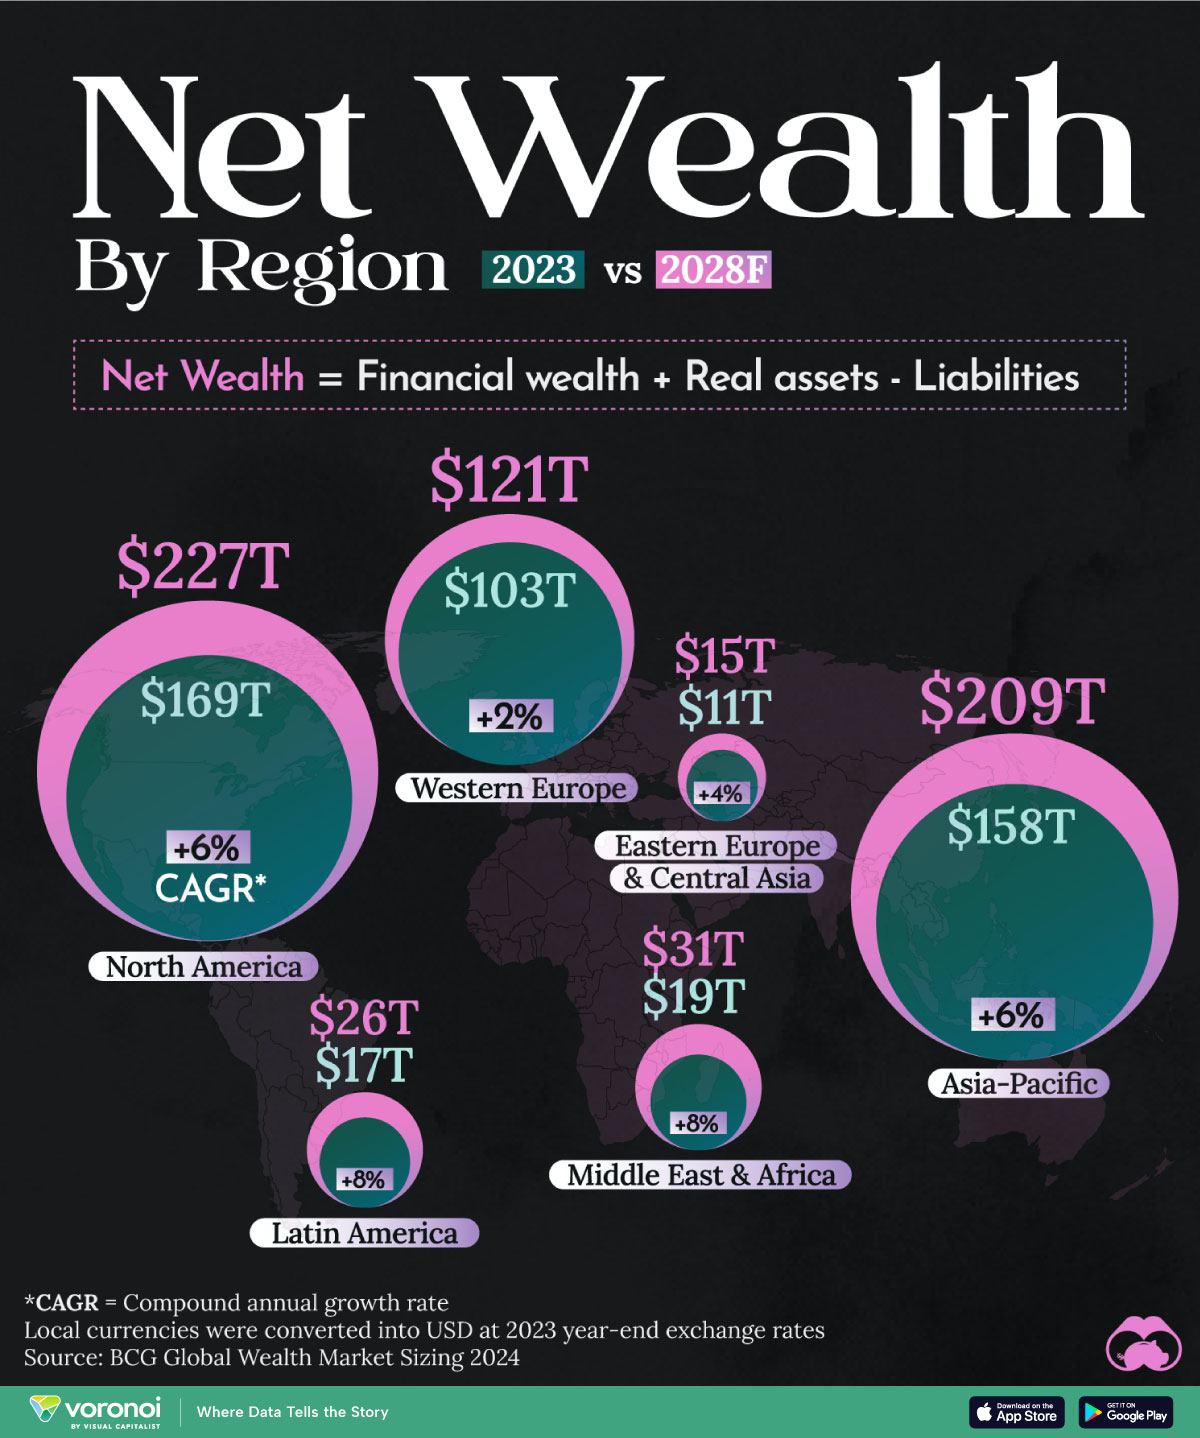
In this graphic, we show a geographical breakdown of global wealth in 2023 and 2028 (forecasted). Figures shown represent net wealth which is equal to financial wealth plus real assets minus liabilities.
Data was sourced from the Boston Consulting Group’s (BCG) Global Wealth Report 2024.
Data and Key Takeaways
The numbers we used to create this graphic are listed in the table below. Local currencies were converted into USD at 2023 year-end exchange rates.
| Region | 2023 | 2028 | CAGR* |
|---|---|---|---|
| North America | $169T | $227T | 6% |
| Latin America | $17T | $26T | 8% |
| Western Europe | $103T | $121T | 2% |
| Eastern Europe & Central Asia | $11T | $15T | 4% |
| Asia-Pacific | $158T | $209T | 6% |
| Middle East & Africa | $19T | $31T | 8% |
*CAGR = Compound annual growth rate
From this dataset we can see that North America, Asia-Pacific, and Western Europe accounted for the vast majority of net wealth in 2023.
This is due to these regions’ diversified economies, advanced financial systems, and high levels of industrialization.
Looking forward to 2028, BCG expects both Latin America and Middle East & Africa to grow the fastest, at an 8% growth rate. Both European regions, on the other hand, are expected to grow at the slowest pace.
Financial Wealth Creation
BCG defines “financial wealth” as cash and deposits, bonds, public and private equities, investment funds, life insurance and pensions, and cross-border wealth.
In 2023, North America accounted for over 50% of all new financial wealth created, largely thanks to robust stock market gains (the S&P 500 rose 24% over the year).
Looking ahead, BCG believes that Asia-Pacific will drive a larger share of financial wealth creation. Of the $92 trillion expected to be created by 2028, North America will account for 44% ($40 trillion), and Asia-Pacific for 29% ($27 trillion).
This is largely due to growth in India, which generated $588 billion in new financial wealth in 2023, the largest in its history.
Información extraída de: https://www.visualcapitalist.com/mapped-global-wealth-by-region-2023-2028f/