
What We’re Showing
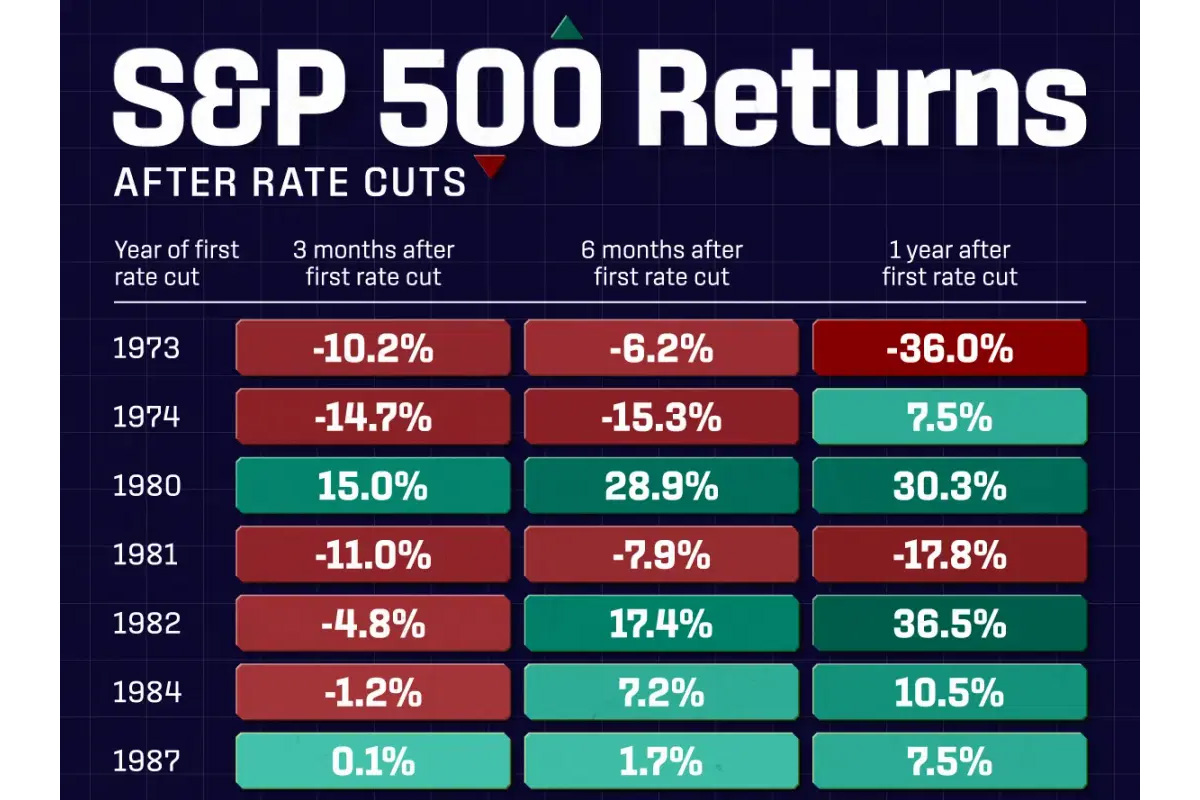
This graphic shows S&P 500 returns after interest rate cuts since 1973, based on data from PinPoint Macro Analytics.
Key Takeaways
- Historically, the S&P 500 returns 4.9% on average one year after the first interest rate cut
- Across 13 rate cut cycles since 1973, the S&P 500 has seen positive annual returns after the first rate cut, with the strongest years being in the early 1980s
- In the first three months following a rate cut, the market tends to decline, but typically rebounds six months after
Dataset
| Year of first rate cut | S&P 500 returns three months after (%) | S&P 500 returns six months after (%) | S&P 500 returns one year after (%) |
|---|---|---|---|
| 1973 | -10.2 | -6.2 | -36 |
| 1974 | -14.7 | -15.3 | 7.5 |
| 1980 | 15 | 28.9 | 30.3 |
| 1981 | -11 | -7.9 | -17.8 |
| 1982 | -4.8 | 17.4 | 36.5 |
| 1984 | -1.2 | 7.2 | 10.5 |
| 1987 | 0.1 | 1.7 | 7.5 |
| 1989 | 7.4 | 7.5 | 11.9 |
| 1995 | 5.1 | 8 | 13.4 |
| 1998 | 17.2 | 26.5 | 27.3 |
| 2001 | -16.3 | -12.4 | -14.9 |
| 2007 | -4.4 | -11.8 | -27.2 |
| 2019 | 3.8 | 13.3 | 14.5 |
| Average | -1.1 | 4.4 | 4.9 |