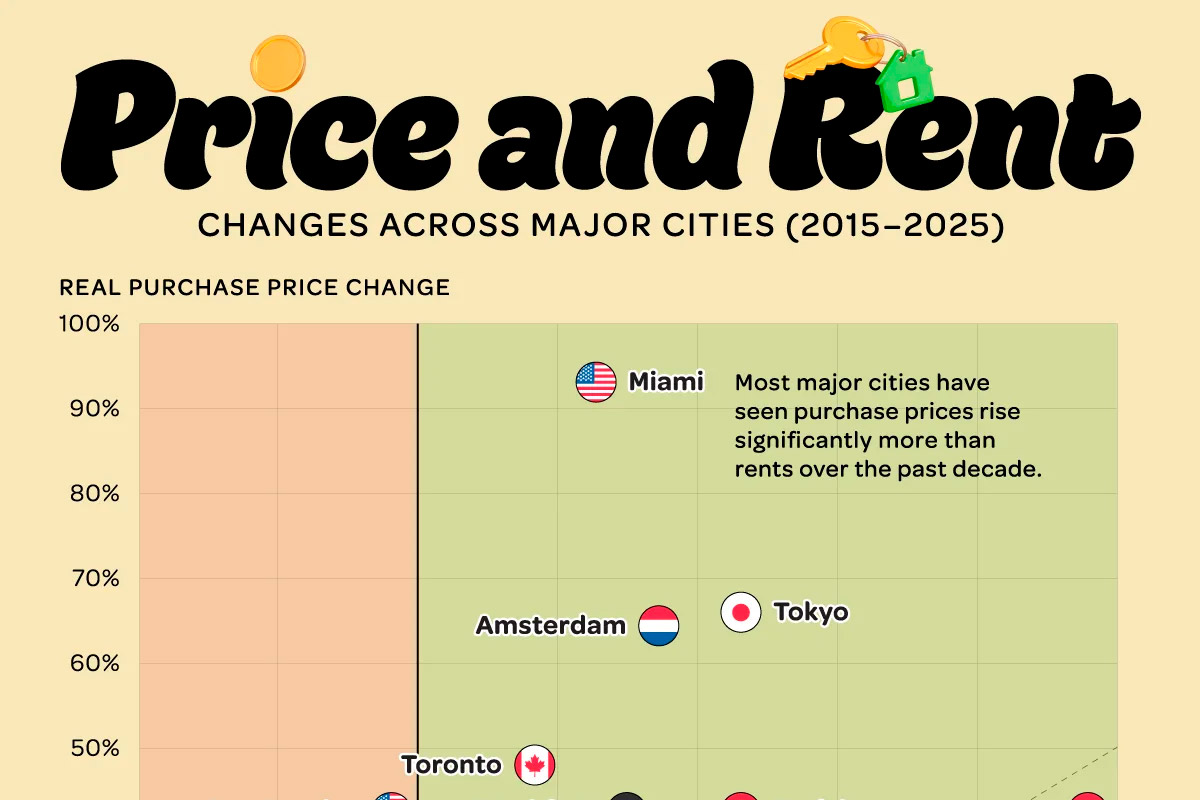
Charted: Home and Rent Price Changes in Global Cities (2015-2025)
From 2015 to 2025, global real estate markets experienced significant divergence between real home price growth and rent price growth.
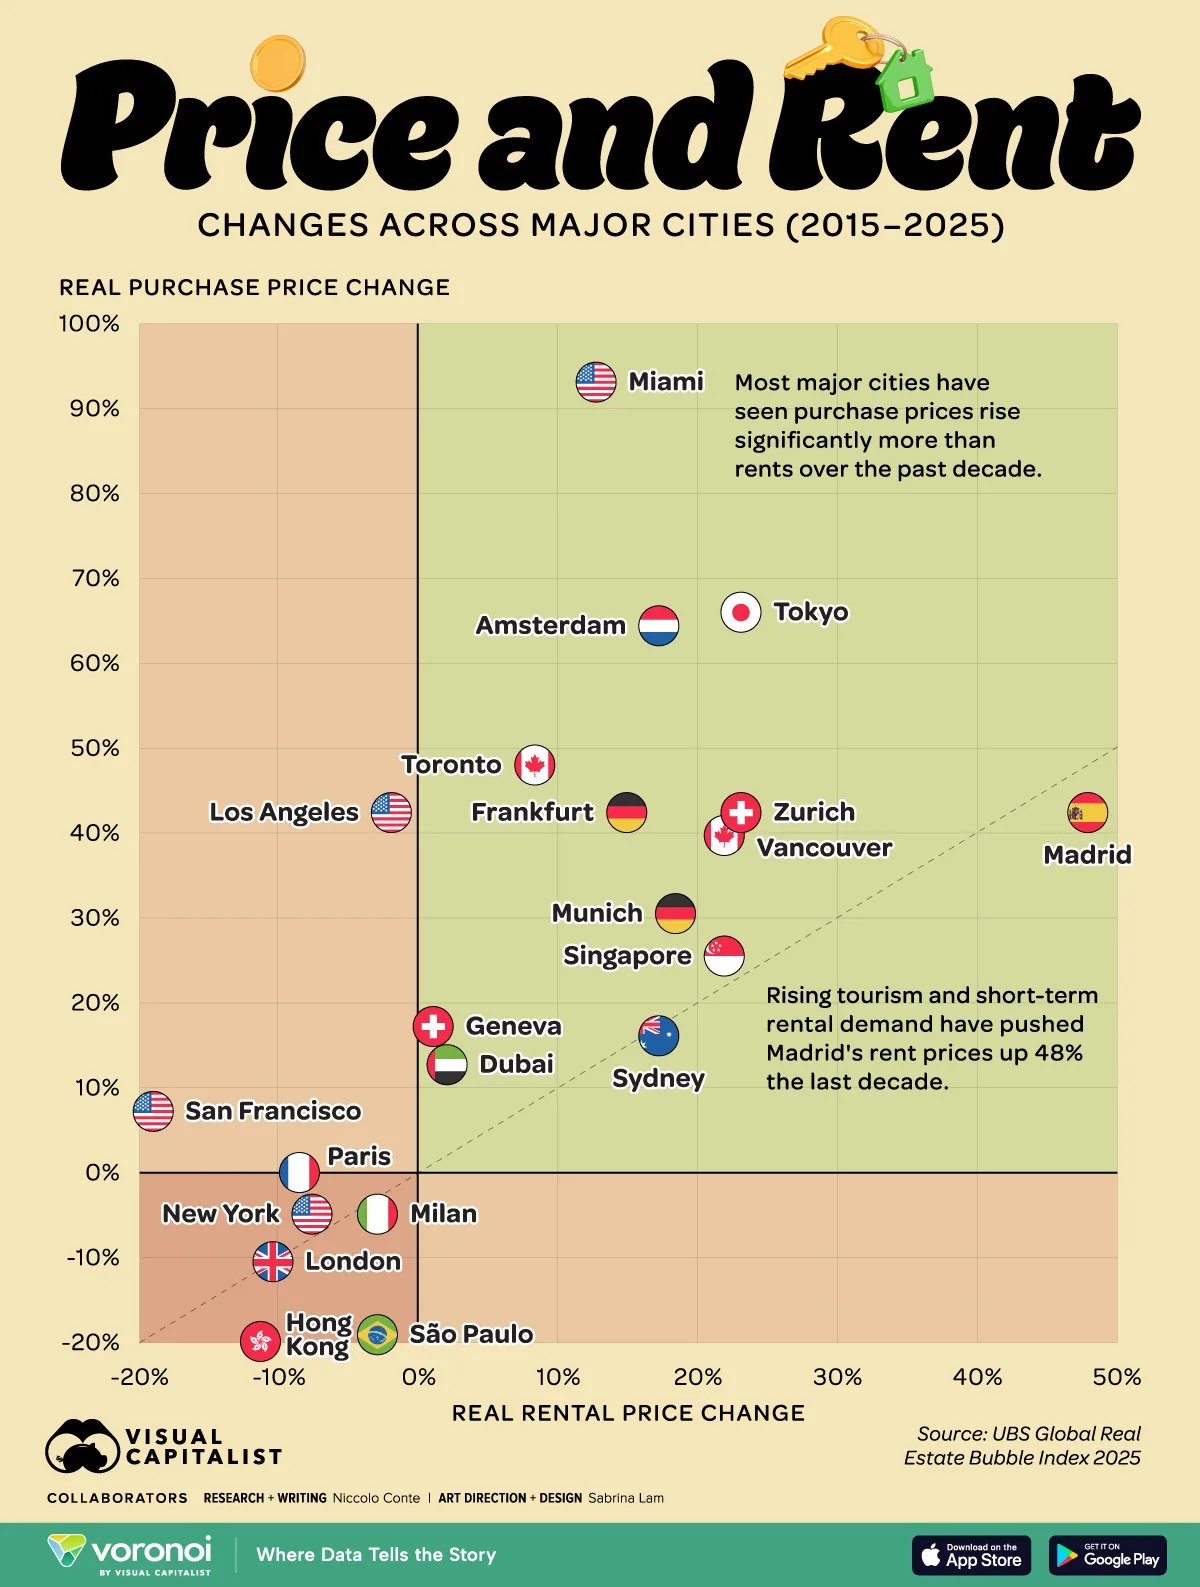
While most major cities saw home values rise faster than rents, a few key markets—particularly in Europe and Asia—showed softening property prices amid slowing demand and tighter credit conditions.
This visualization highlights 25 major global cities from the UBS Global Real Estate Bubble Index 2025, comparing inflation-adjusted percentage changes in both home and rental prices over the past decade
Miami Leads Global Home Price Growth Since 2015
Miami topped the list with a staggering 93.1% increase in real home prices, showing the strongest decade-long appreciation globally.
Despite this, rent prices grew only 12.7%, reflecting a widening affordability gap.
The data table below shows the real home price change and real rent price change across 25 major cities around the world.