
How Many Years Do You Have Left to Live?
At the start of the 19th century, when there fewer than 1 billion humans on the earth, global life expectancy at birth stood at roughly 29 years.
This is a startlingly low figure—because life expectancy is a statistical projection of how many more years a person can expect to live, based on the mortality rates at the time. And since the infant mortality rate in particular was so high, life expectancies accurately summarized the low likelihood of many babies living to adulthood.
However, since the 1920s, life expectancy across all ages has improved leaps and bounds, thanks to rapid advancements in nutrition, healthcare, and sanitation.
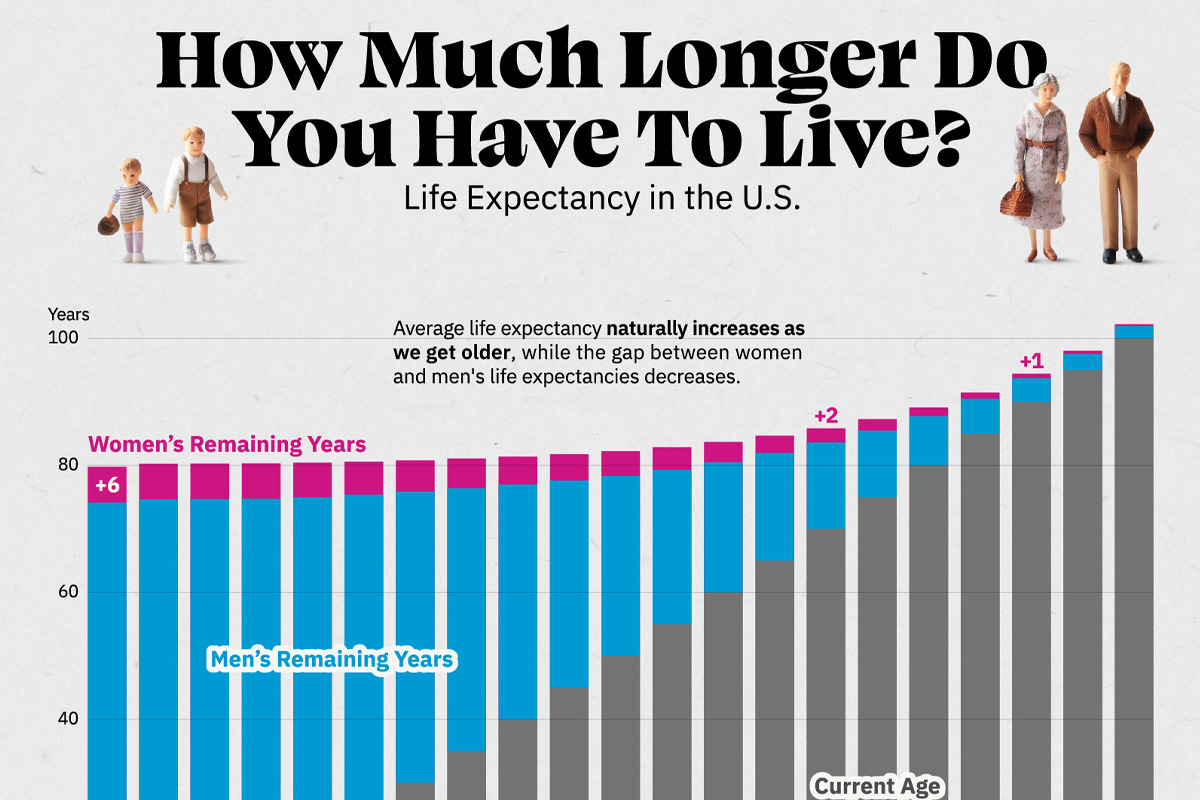
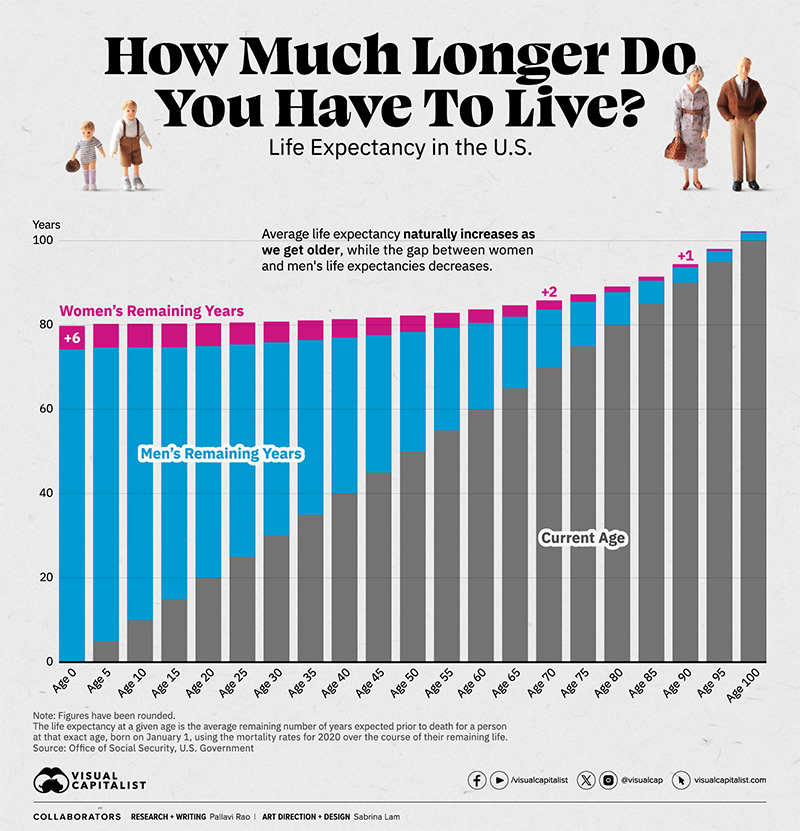
We visualized the current American life expectancy by age and gender, using data from the Office of Social Security, which bases their current projections on 2020 mortality rates.
American Life Expectancy at Every Age
A key takeaway with life expectancy is that it increases as one gets older. This is easily seen in the table below, which lists the remaining years left to live at a given age for an American male and the projected life expectancy.
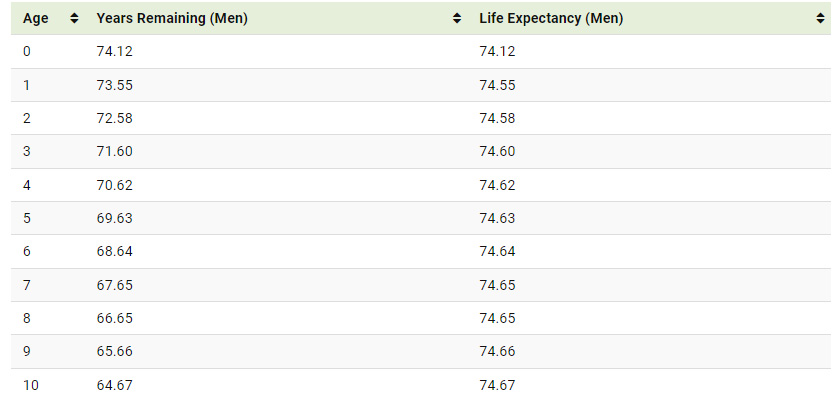
At birth, an average American baby boy can expect to live till just past 74. But if the boy reaches adulthood, then at 21 he might live to a full year more, past 75. This trend persists even towards the end of life when the years we have left drop rapidly, influenced by the higher likelihood of death.
American women, on the other hand, have a higher life expectancy than men. At birth the gap is close to six years, narrowing steadily to around one year by 85.
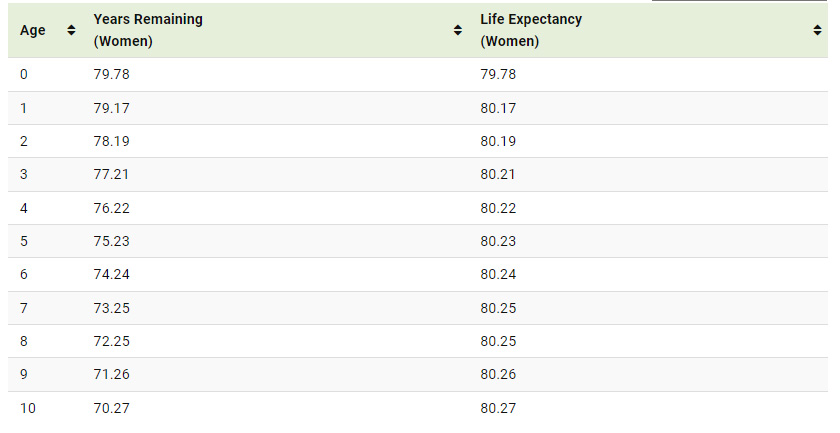
Interestingly, women outlive men in nearly every country in the world, due to a mix of sociological, behavioral, and biological reasons.
COVID-19: Reversing A Decade of Increasing American Life Expectancy
While the current American life expectancy at birth seems reasonably high, it is nearly two years lower than the 2022 figure which used the 2019 mortality rate. It is also lower than the life expectancy at birth in 2009, which used 2005 mortality rate.
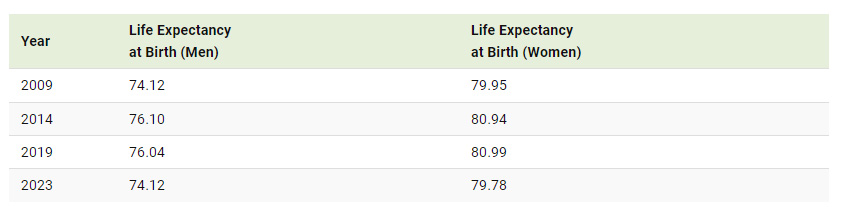
American mortality rates went up 17% between 2019–2020, in part because of COVID-19, in turn affecting life expectancy. The U.S. also had a higher COVID-19 mortality rate compared to its peers two years after the pandemic first struck.
Thus, American life expectancy may not improve immediately to 2019 levels, which can affect insurance premiums, pension benefits, and plans.