
There are many reasons for why salaries vary between countries: economic development, cost of living, labor laws, and a variety of other factors. Because of these variables, it can be difficult to gauge the general level of income around the world.
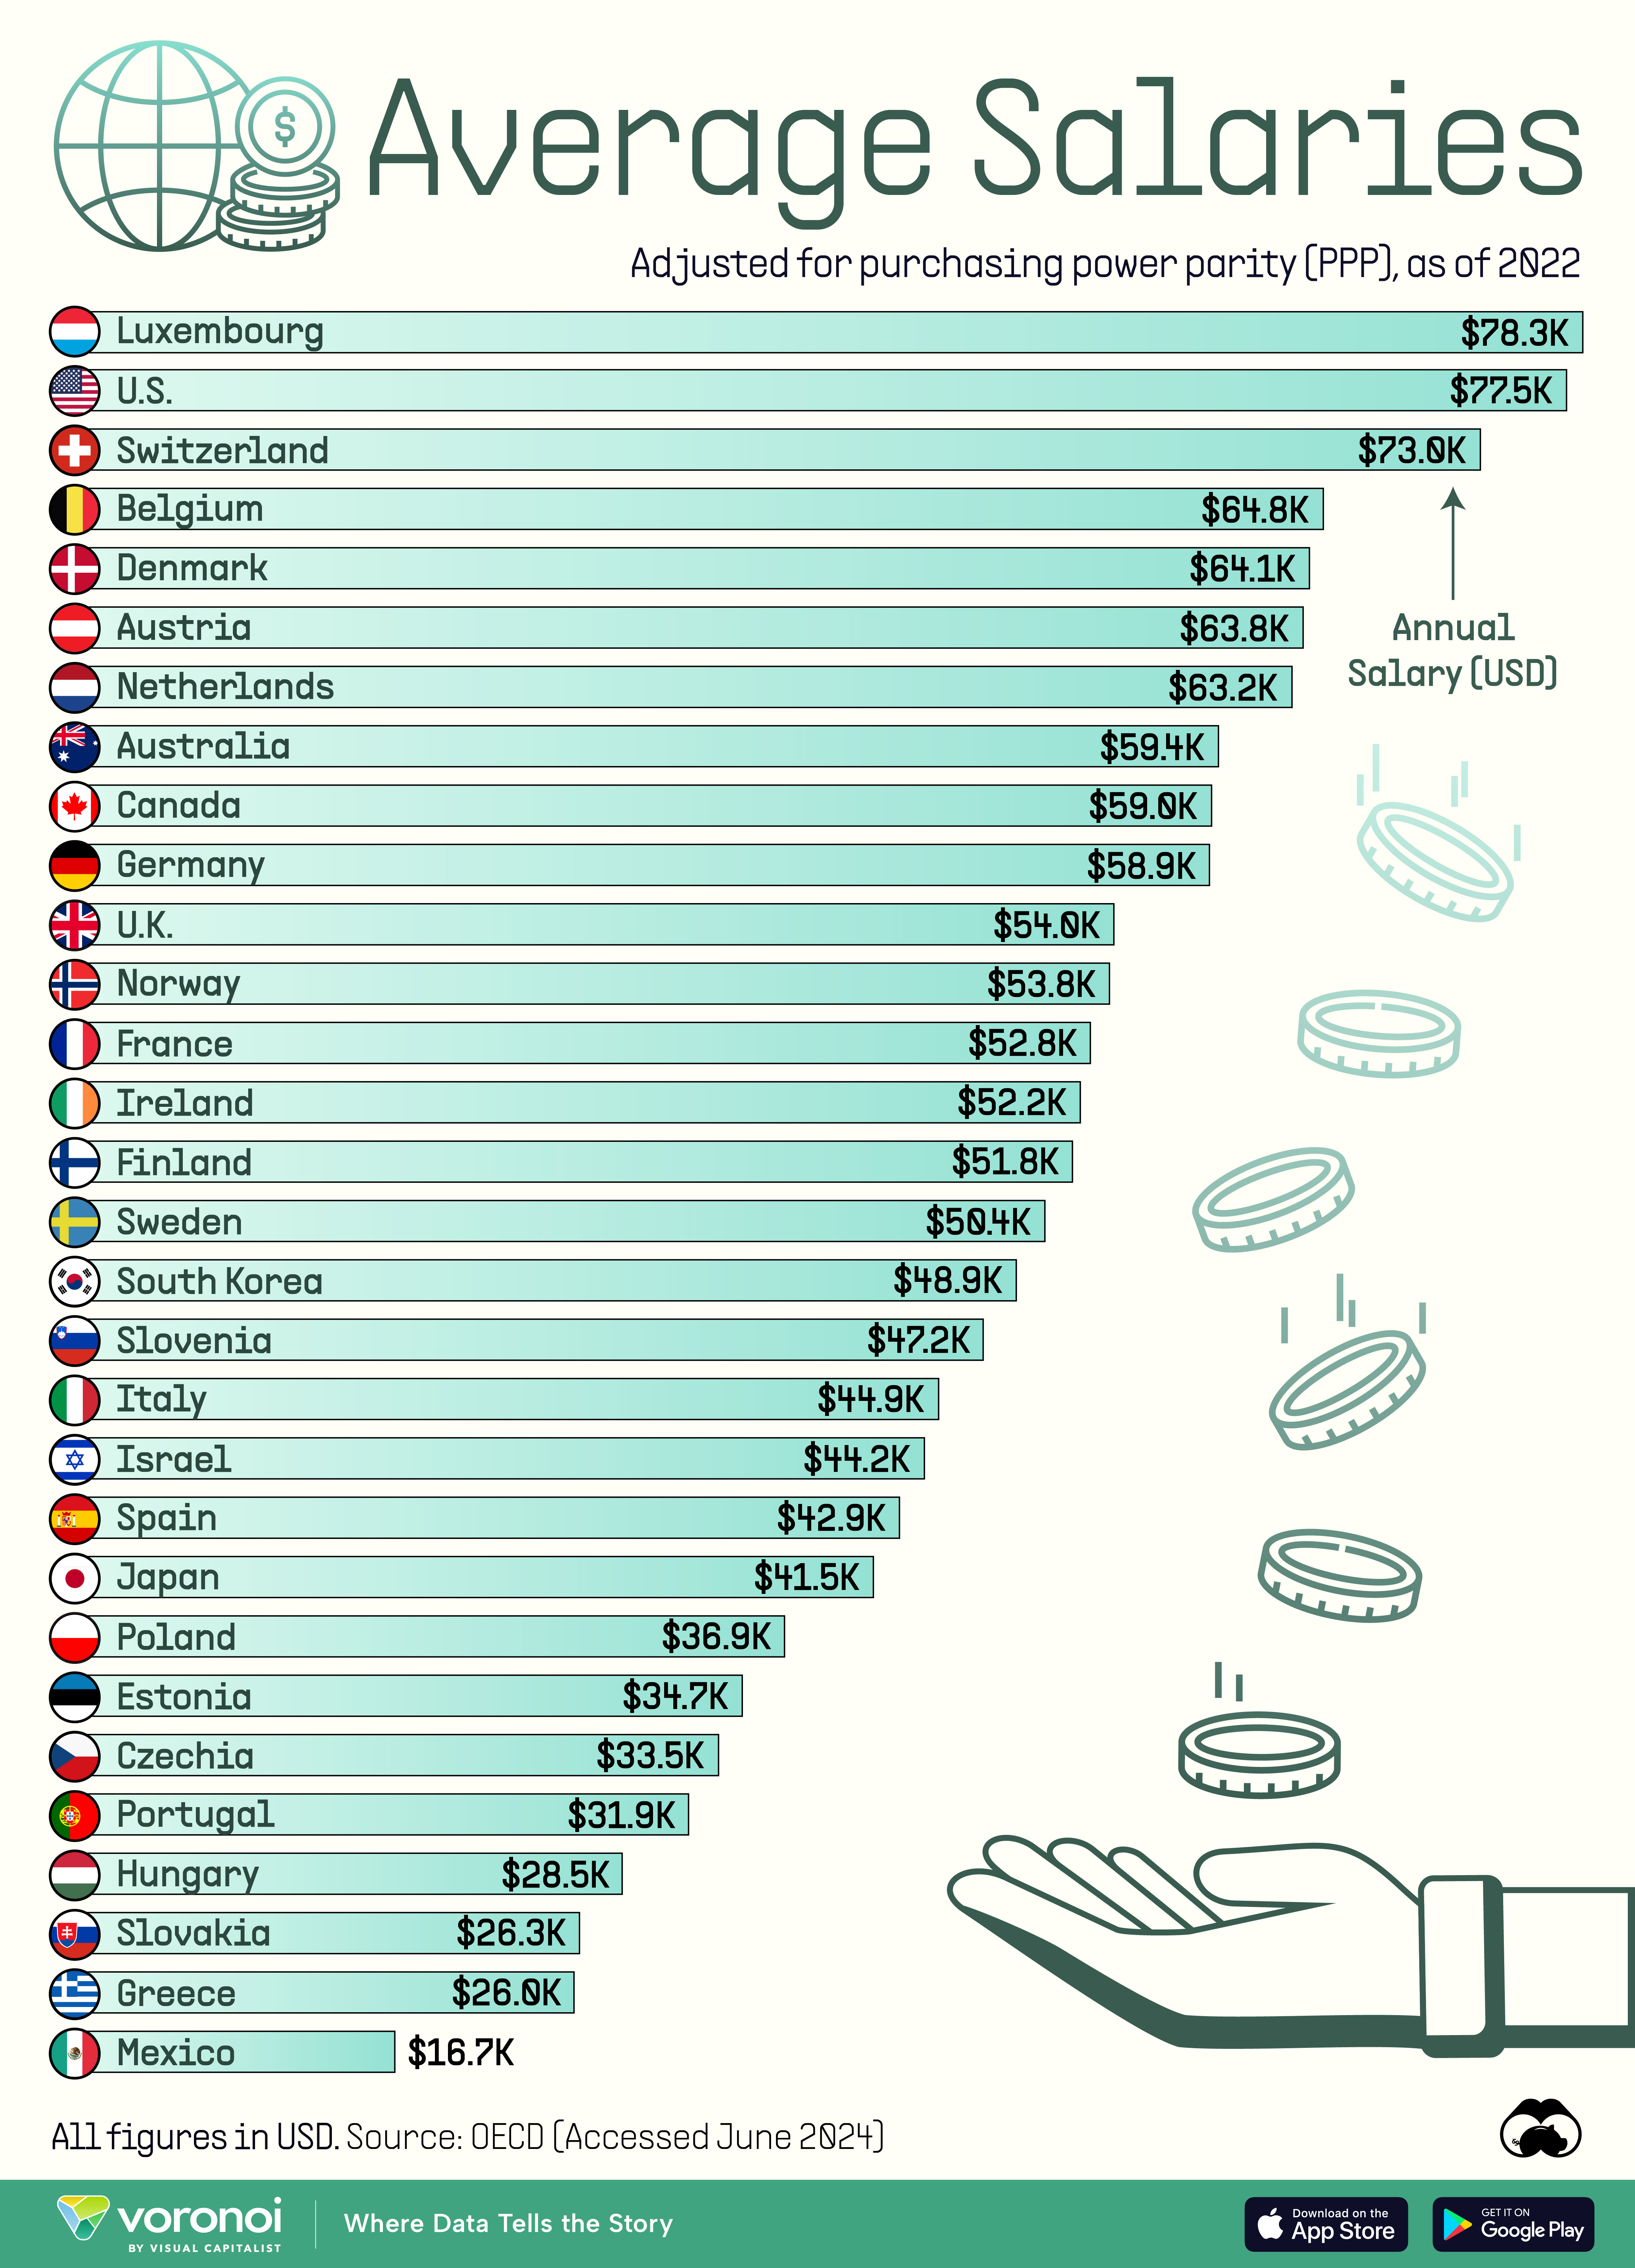
With this in mind, we’ve visualized the average annual salaries of 30 OECD countries, adjusted for purchasing power parity (PPP). This means that the values listed have taken into account the differences in cost of living and inflation between countries.
Data and Key Takeaways
This data was sourced from the OECD (Organisation for Economic Co-operation and Development), an international organization that promotes policies to improve economic and social well-being. It has 38 member countries, though in this instance, data for all of them was not available.
All figures are as of 2022.
| Rank | Country | Average Annual Salary (USD, PPP adjusted) |
|---|---|---|
| 1 | 🇱🇺 Luxembourg | 78,310 |
| 2 | 🇺🇸 U.S. | 77,463 |
| 3 | 🇨🇭 Switzerland | 72,993 |
| 4 | 🇧🇪 Belgium | 64,848 |
| 5 | 🇩🇰 Denmark | 64,127 |
| 6 | 🇦🇹 Austria | 63,802 |
| 7 | 🇳🇱 Netherlands | 63,225 |
| 8 | 🇦🇺 Australia | 59,408 |
| 9 | 🇨🇦 Canada | 59,050 |
| 10 | 🇩🇪 Germany | 58,940 |
| 11 | 🇬🇧 UK | 53,985 |
| 12 | 🇳🇴 Norway | 53,756 |
| 13 | 🇫🇷 France | 52,764 |
| 14 | 🇮🇪 Ireland | 52,243 |
| 15 | 🇫🇮 Finland | 51,836 |
From this dataset we can see that Luxembourg, the U.S., and Switzerland offer the highest average annual salaries.
All three of these countries are highly developed economies with well-established service sectors, which typically lead to more high-paying jobs. The cost of living in these countries is also relatively high, necessitating higher wages to maintain a standard quality of life.
At the other end of this ranking, Mexico and Greece have the lowest average salaries. In Mexico’s case, the country’s economy has a large portion of lower-wage jobs, particularly in agriculture and manufacturing.
Greece, on the other hand, has struggled with consistently high unemployment since the 2008 global financial crisis. This puts downward pressure on wages because there is a surplus of labor.
Información extraída de: https://www.visualcapitalist.com/ranked-average-annual-salaries-by-country/