
The Countries Powering Trade Volume Growth (2019-2024)The Countries Powering Trade Volume Growth (2019-2024)The Countries Powering Trade Volume Growth (2019-2024)The Countries Powering Trade Volume Growth (2019-2024)
  • INICIO
  • SERVICIOS
    • Planeación financiera
    • Ahorro e Inversión
    • Planeación patrimonio familiar
    • Educación financiera
      • Glosario
  • NUESTRAS SOLUCIONES
    • Planeación financiera personalizada
    • Soluciones de ahorro e inversión
    • Planeación patrimonial familiar
    • Soluciones complementarias
  • BLOG
    • Actualidad
    • Ahorro e Inversión
    • Educación Financiera
    • Patrimonio Familiar
    • Pensiones
    • Planeación Financiera
    • Videos
  • NOSOTROS
  • CONTACTO
✕
Entre más impuestos y revaluación
5 septiembre, 2025
Eco Data Confirms 25 Bps Fed Cut, Pimco’s Wilding Says
12 septiembre, 2025
Published by grafico@cosmonaut.com.co on 12 septiembre, 2025
Categories
  • Actualidad
Tags

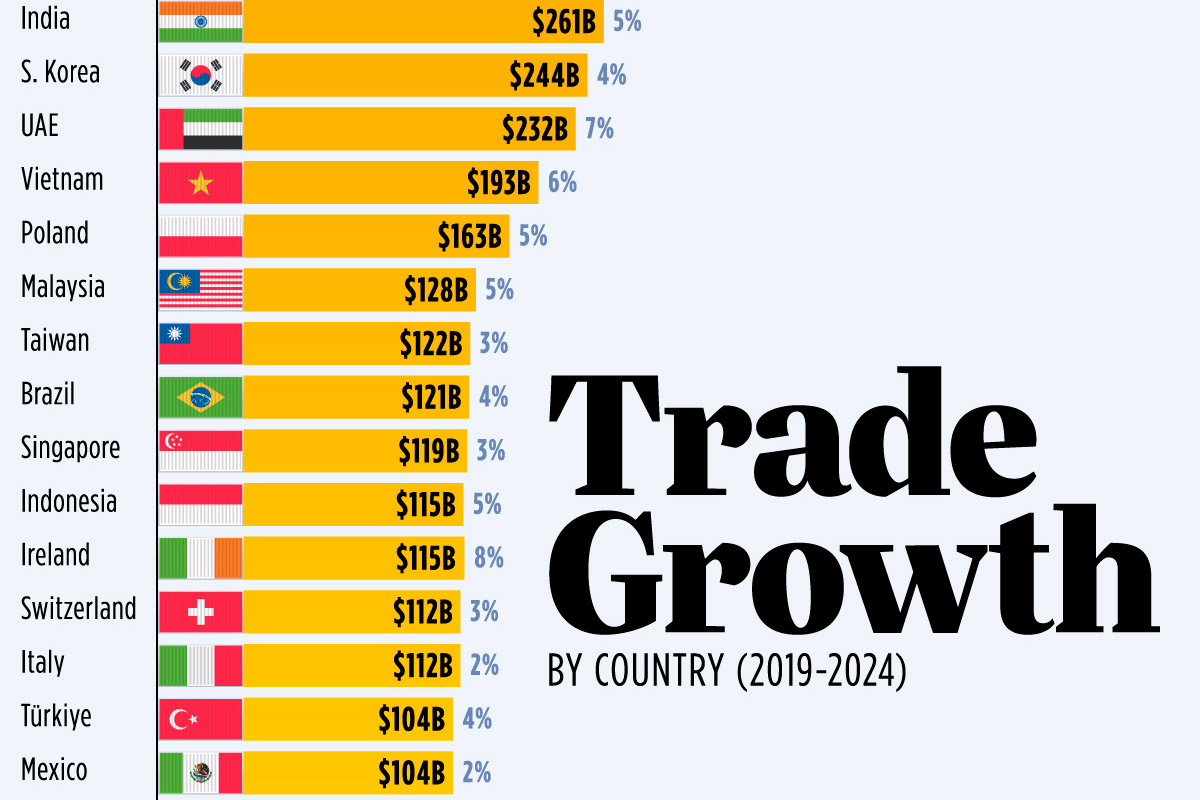
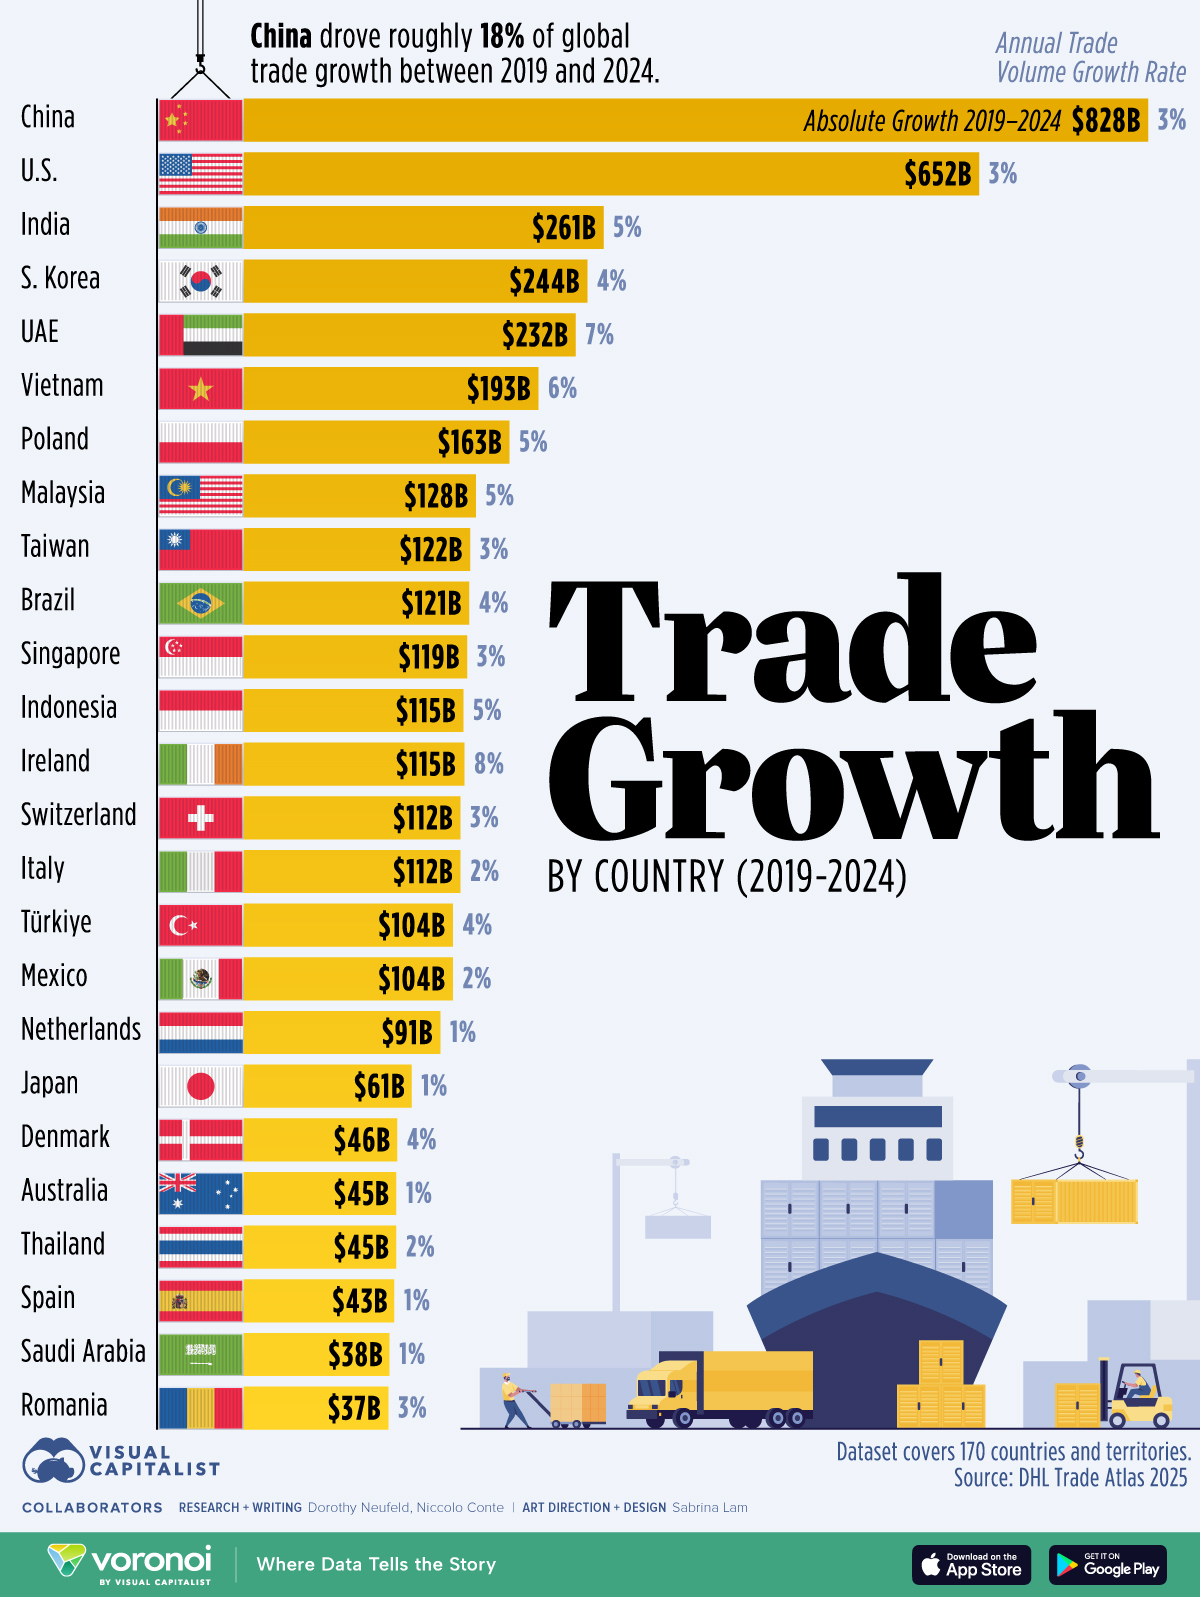
Horizontal bar chart showing trade volume growth by country between 2019 and 2024.

The Countries Powering Trade Volume Growth (2019-2024)

In 2024, global trade hit a record $33 trillion, expanding by $1 trillion.

Despite geopolitical challenges, trade remained resilient, fueled by strong U.S. consumer demand and a 12% jump in China’s exports. Notably, newer markets like Africa and India are emerging as China’s fastest-growing export destinations in 2025.

This graphic shows the countries with the largest absolute trade volume growth since 2019, based on data from the DHL Trade Atlas 2025.

The Top 25 Countries by Trade Volume Growth

Below, we show how China and the U.S. dominate the rankings, driving a combined $1.5 trillion in trade volume growth since 2019:

Ranking Country Absolute Trade Growth
2019-2024
Annual Trade Volume
Growth Rate
1 🇨🇳 China $828B 3%
2 🇺🇸 U.S. $652B 3%
3 🇮🇳 India $261B 5%
4 🇰🇷 South Korea $244B 4%
5 🇦🇪 UAE $232B 7%
6 🇻🇳 Viet Nam $193B 6%
7 🇵🇱 Poland $163B 5%
8 🇲🇾 Malaysia $128B 5%
9 🇹🇼 Taiwan $122B 3%
10 🇧🇷 Brazil $121B 4%

In 2024, China’s total trade value stood at $6.3 trillion, the largest globally.

Given its manufacturing might, it is the world’s largest exporter, and second-largest importer after America. Overall, trade volumes increased by $828 billion in the five-year period, rising at an average annual rate of 3%.

For America, trade volume grew by $652 billion over the period, with its largest trade partners by import value standing as Mexico, China, and Canada. Overall, America’s total trade value stood at $5.4 trillion, trailing China by $900 billion.

As we can see, India ranks in third, with volumes rising by 5% on average annually. Not only that, it is projected to increase its total trade volume by 85% between 2024 and 2029 compared to the previous five-year period. Fueling this trend are its rapidly growing economy and trade-flow shifts as companies diversify supply chains from China.

Información extraída de: https://www.visualcapitalist.com/countries-powering-trade-volume-growth-since-2019/


Share
0
grafico@cosmonaut.com.co

Related posts

29 mayo, 2026

Un comienzo que preocupa más


Read more
29 mayo, 2026

La IA, un arma de poder a los ojos del Papa


Read more
29 mayo, 2026

Siempre habrá un país después del domingo


Read more

Comments are closed.

Titulo

Respuesta

TASA REAL DE RENTABILIDAD E.A. :
USTED DEBE AHORRAR PERIODICAMENTE:

Observaciones

Besta - 2020
    383 766 284