Frequency of Billion-Dollar Disasters in the U.S.
Wildfires on the Hawaiian island of Maui have had devastating effects on people, towns, and nature, and the final cost is nowhere near tallied. They are the latest of many climate disasters in the U.S.—and data shows that their frequency has been increasing.
These graphics from Planet Anomaly use tracking data from the National Oceanic and Atmospheric Administration (NOAA) to show the average number of days between billion-dollar weather disasters in the U.S. from 1980 to 2022.
Methodology
NOAA’s database examines billion-dollar weather and climate disasters in America. Total associated damages and costs for each event are adjusted for inflation using the 2023 Consumer Price Index (CPI).
Disasters are categorized as one of seven different types:
- Drought: Prolonged dry spells resulting in water shortages and reduced soil moisture.
- Flooding: Overflow of water inundating land usually due to intense rainfall or melting snow.
- Tropical Cyclone: Intense rotating storm systems known as hurricanes.
- Severe Storm: Includes windstorms and tornadoes, hail, lightning, and heavy precipitation.
- Winter Storm: Heavy snow, freezing rain, and icy conditions impacting transportation and infrastructure.
- Wildfire: Uncontrolled fires consuming vast areas of forests and vegetation.
- Freezes: Sub-zero temperatures damaging crops and infrastructure, such as pipes or energy lines.
The average days between billion-dollar disasters are calculated from the start dates of adjacent events within a single year.
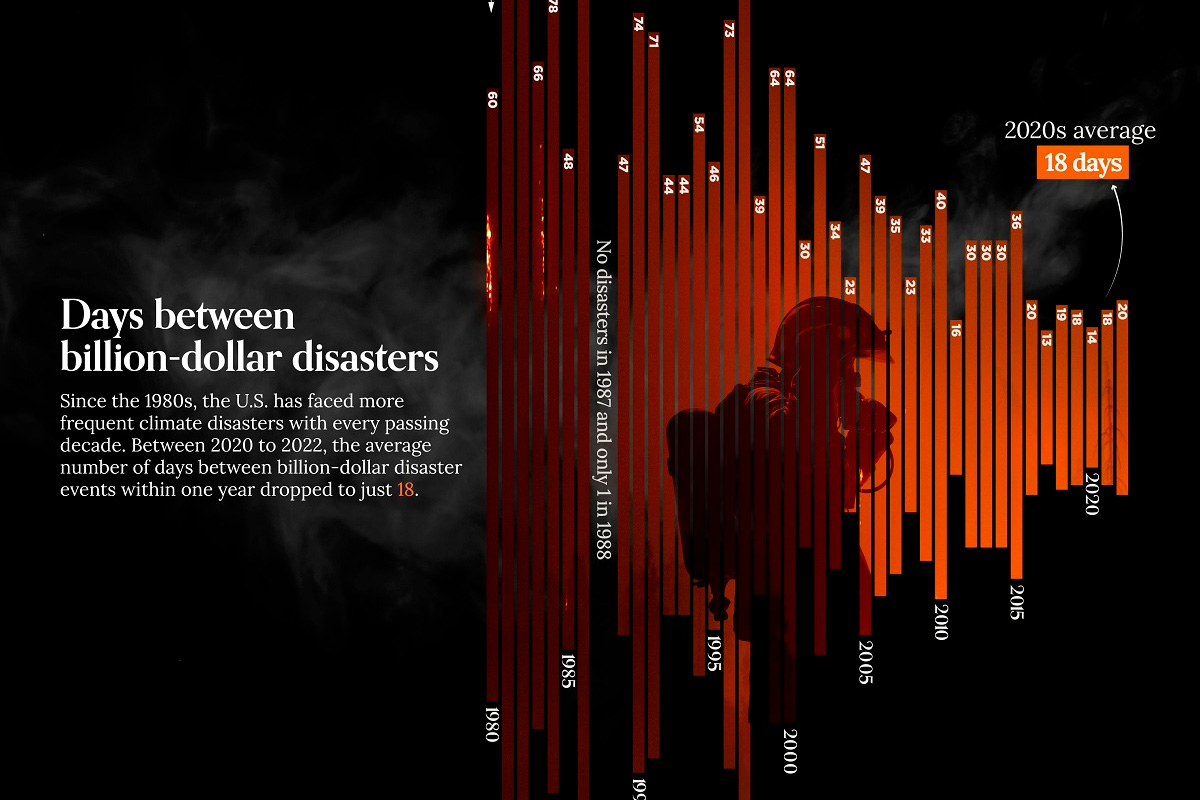
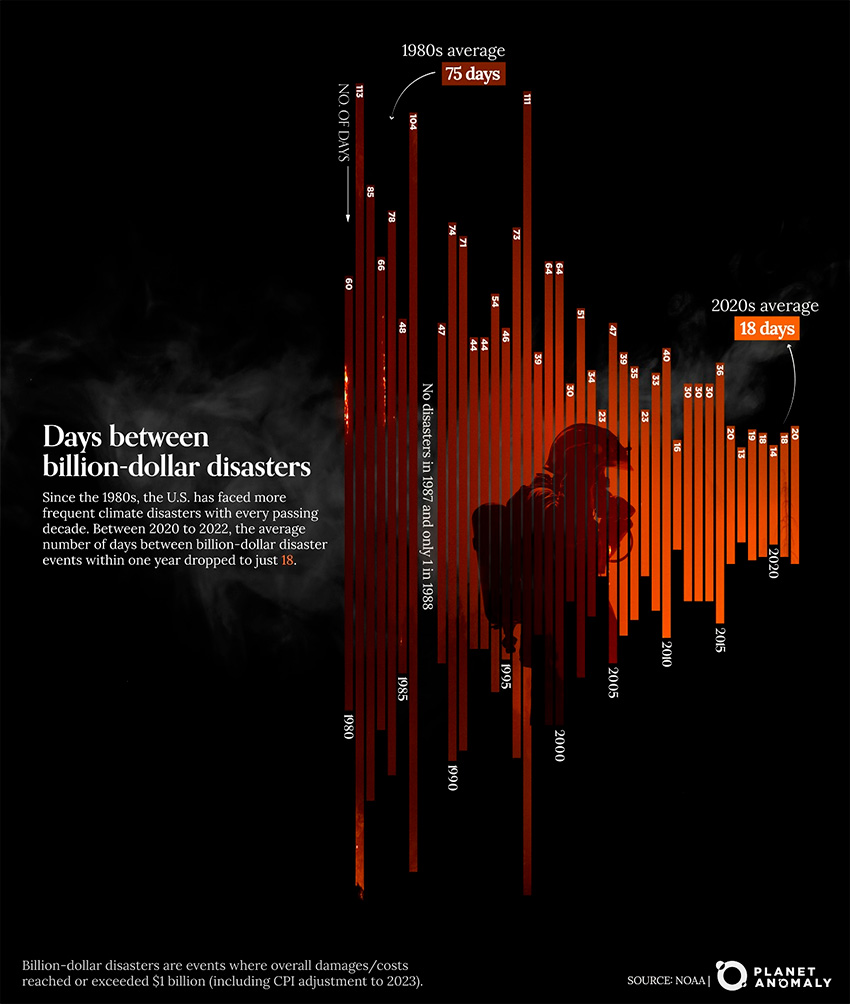
Days Between Billion-Dollar Disasters in the U.S. (1980‒2022)
Between 1980 and 2022, there were 155 total disasters in the U.S. that cost more than a billion dollars in damages when adjusted for inflation.
And when looking at the average number of days between these billion-dollar events within each year, we can see the decades becoming more and more costly:

Back in the early 1980s, the average interval between these major disasters (within each year) was 75 days. Even more starkly, 1987 had no climate disasters that topped $1 billion in damages, while 1988 only had one.
Fast forward to 2022, and that average window has drastically reduced to a mere 20 days between billion-dollar disasters in the United States.
Breaking Down Billion-Dollar Disasters by Type
Of the 155 disasters tracked through 2022, the majority have been in the form of severe storms including tornadoes, windstorms, and thunderstorms.
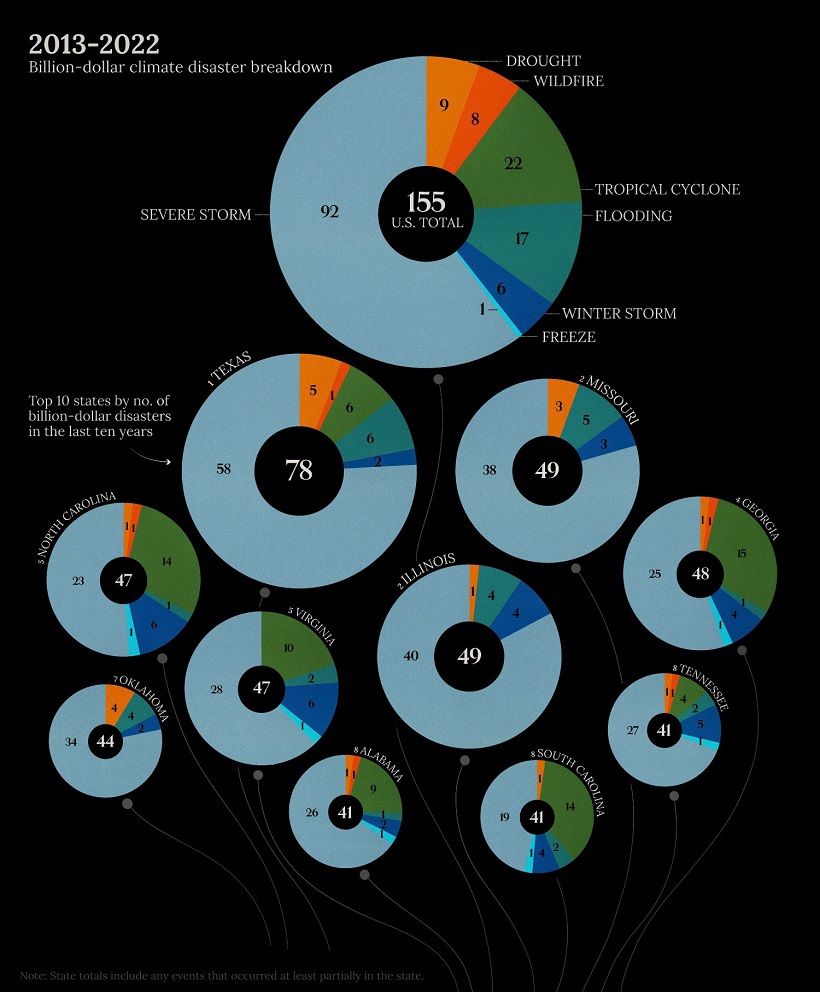
The worst severe storms include an outbreak of tornadoes in April 2011 across many central and southern states, with an estimated 343 tornadoes causing a total of $14 billion in CPI-adjusted damages. In August 2020, a powerful derecho—a widespread and intense windstorm characterized by straight-line winds—devastated millions of acres of crops across the Midwest and caused $13 billion in adjusted damages.
But the most expensive disasters so far have been hurricanes. Eight hurricanes top the inflation-adjusted damages charts, with Hurricane Katrina’s unprecedented devastation in 2005 leading with a staggering $194 billion.
Will the U.S. be prepared for more costly disasters going forward? And will climate change continue to accelerate the pace of weather disasters in the U.S. even more?
Information extracted from: https://www.visualcapitalist.com/cp/billion-dollar-disasters-in-the-us/