Comparing the Economies of U.S. and China in 3 Key Metrics
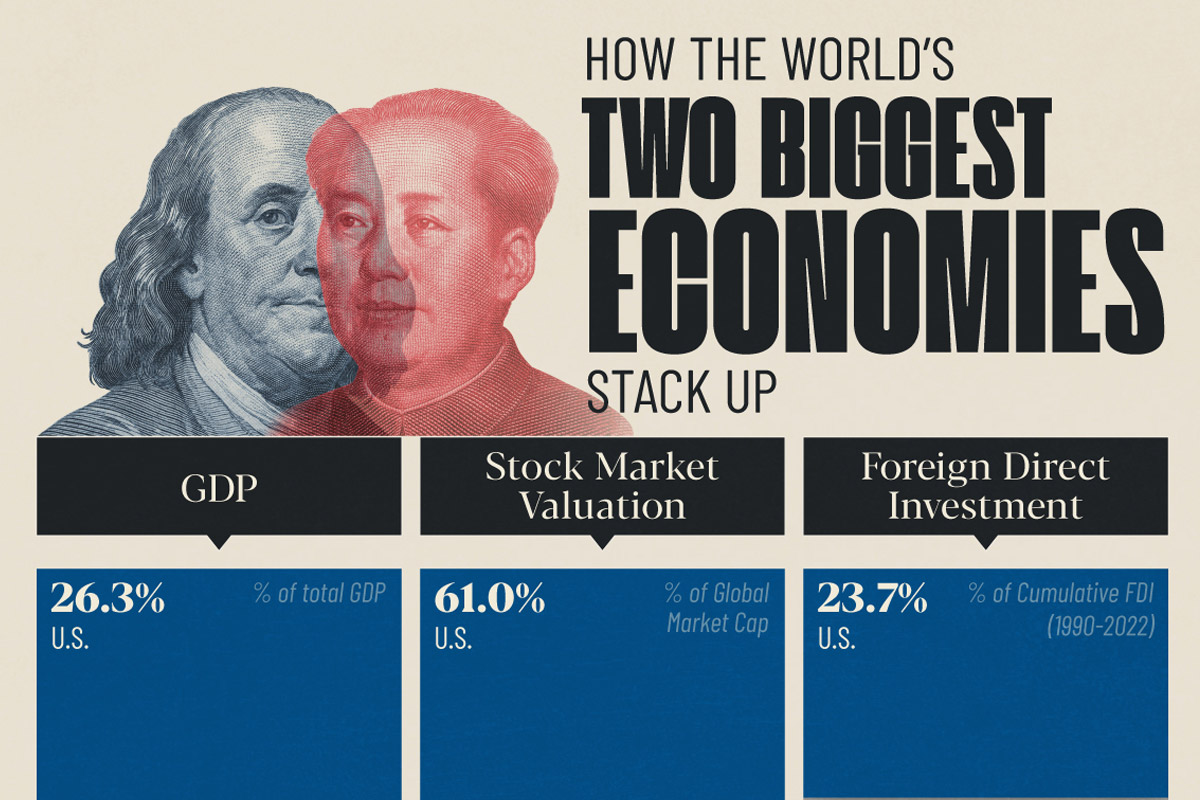
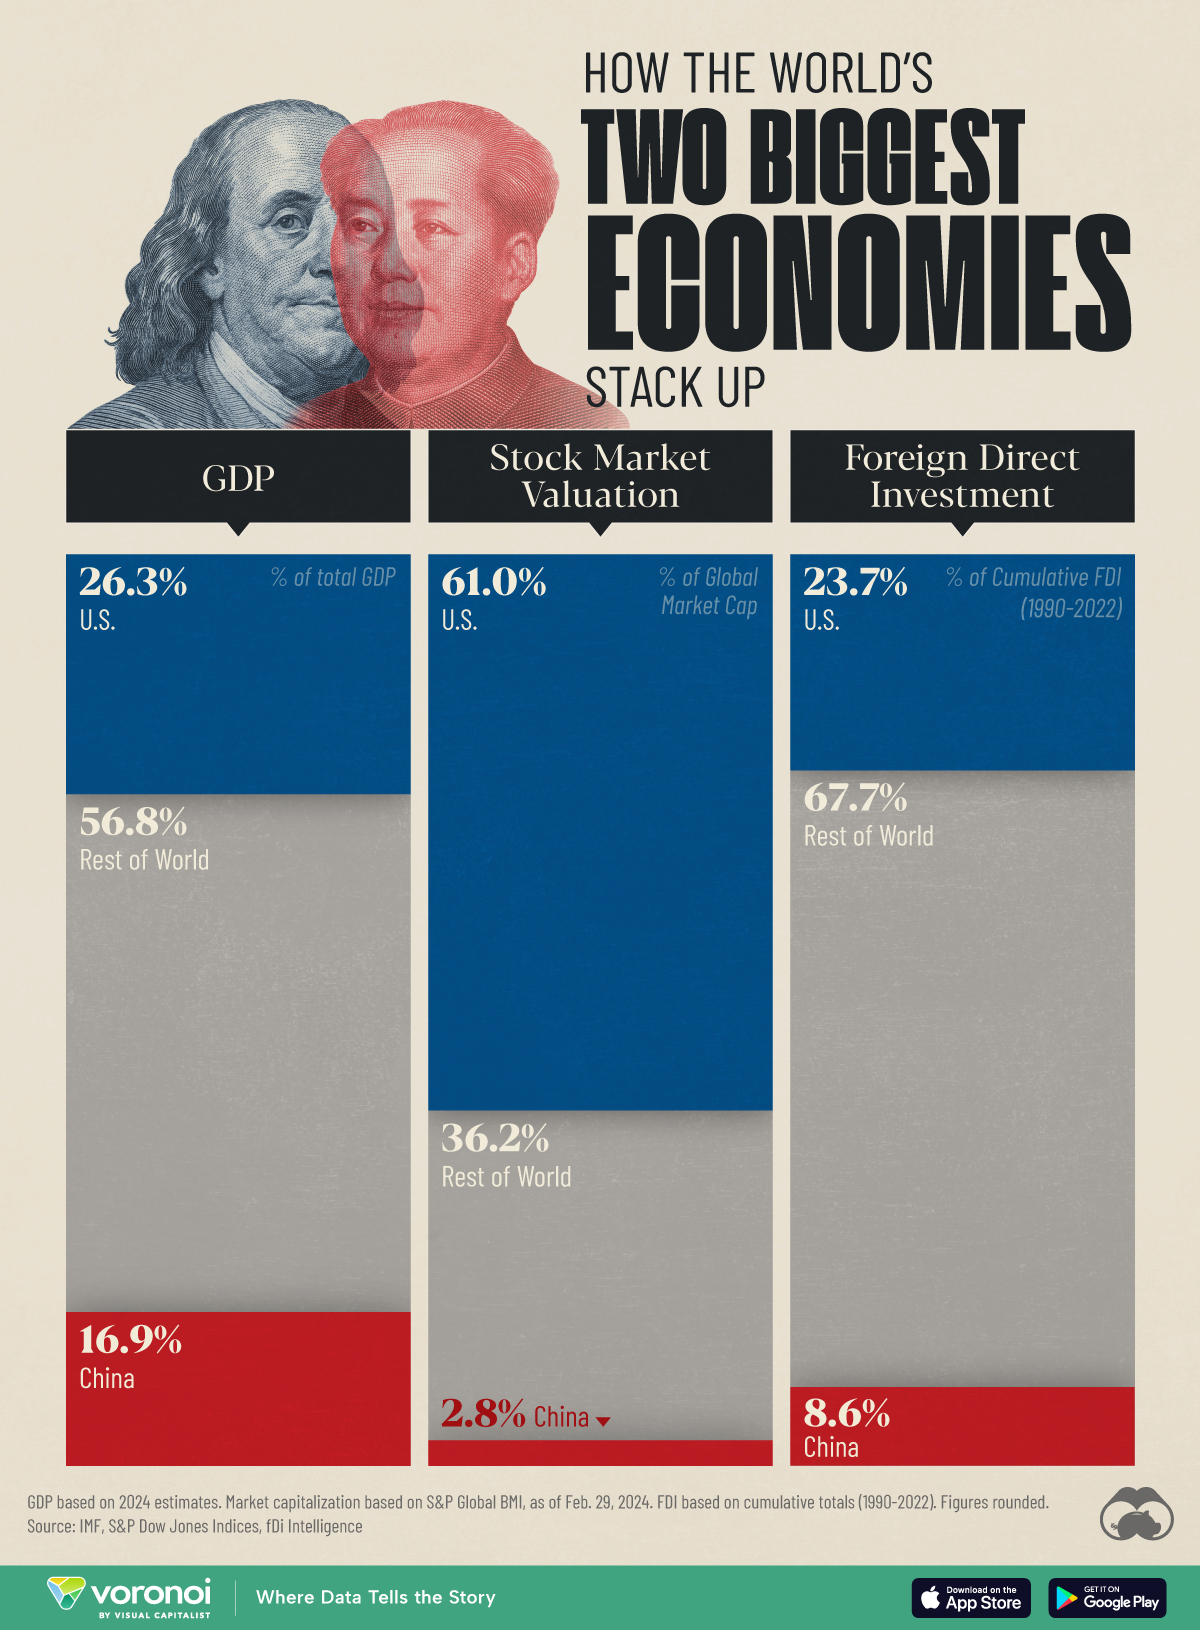
In this graphic, we provide insight into the world’s two biggest economies by comparing them across three key metrics: GDP, equity market valuation, and foreign direct investment (FDI).
Starting with GDP, we used 2024 estimates from the latest edition of the IMF’s World Economic Outlook (April 2024):
| Country | GDP (% of total) | GDP (USD billions) |
|---|---|---|
| 🇺🇸 U.S. | 26.3 | $28,780 |
| 🇨🇳 China | 16.9 | $18,530 |
| 🌍 Rest of World | 56.8 | $62,220 |
Based on these figures, the United States and China combine for a massive 43.2% share of the global economy.
It’s also interesting to note that America’s share of global GDP has actually been increasing in recent years, from a low of 21.1% in 2011. This is partly due to its relatively strong recovery from the COVID-19 pandemic.
Equity Market Valuation
The U.S. dominates when it comes to stock market valuation, accounting for 61% of the global total as of Feb. 29, 2024. These figures are based on each country’s share of the S&P Global BMI, which is a broad coverage index, including large, mid, and small-cap stocks from developed and emerging markets.
| Country | % of Global Market Cap |
|---|---|
| 🇺🇸 U.S. | 61.0 |
| 🇨🇳 China | 2.8 |
| 🌍 Rest of World | 36.2 |
The massive disparity in equity market valuations between the U.S. and China is a result of differences in many factors, including market maturity, corporate governance, and international participation.
In terms of country rankings within the S&P Global BMI, China is the fourth largest (behind Japan and the UK).
Foreign Direct Investment
FDI is an investment made by a firm or individual in one country into business interests located in another country. This type of investment can be very beneficial because it can create jobs and enhance economic growth. The FDI figures in this graphic were sourced from fDi Intelligence, and represent cumulative FDI stock from 1990 to 2022.
| Country | % of Global FDI | FDI (current USD) |
|---|---|---|
| 🇺🇸 U.S. | 23.7 | $10.5T |
| 🇨🇳 China | 8.6 | $3.8T |
| 🌍 Rest of World | 67.7 | $30.0T |
The U.S. and China are first and second in terms of cumulative FDI stock. Attracting FDI is one area where China has performed very strongly in recent years.
For example, in 2012, China had attracted $950 billion in FDI, good enough for sixth place. As of 2022, China’s total had grown to $3.8 trillion, a testament to its attractiveness to global businesses, even in the face of regulatory challenges and geopolitical tensions.
Learn More About the Global Economy From Visual Capitalist
If you enjoyed this graphic, check out this graphic ranking the world’s biggest stock markets by country.
Información extraída de https://www.visualcapitalist.com/the-worlds-largest-economies-comparing-the-u-s-and-china/