Visualized: How U.S. Jobs Shifted Between 2002 and 2024
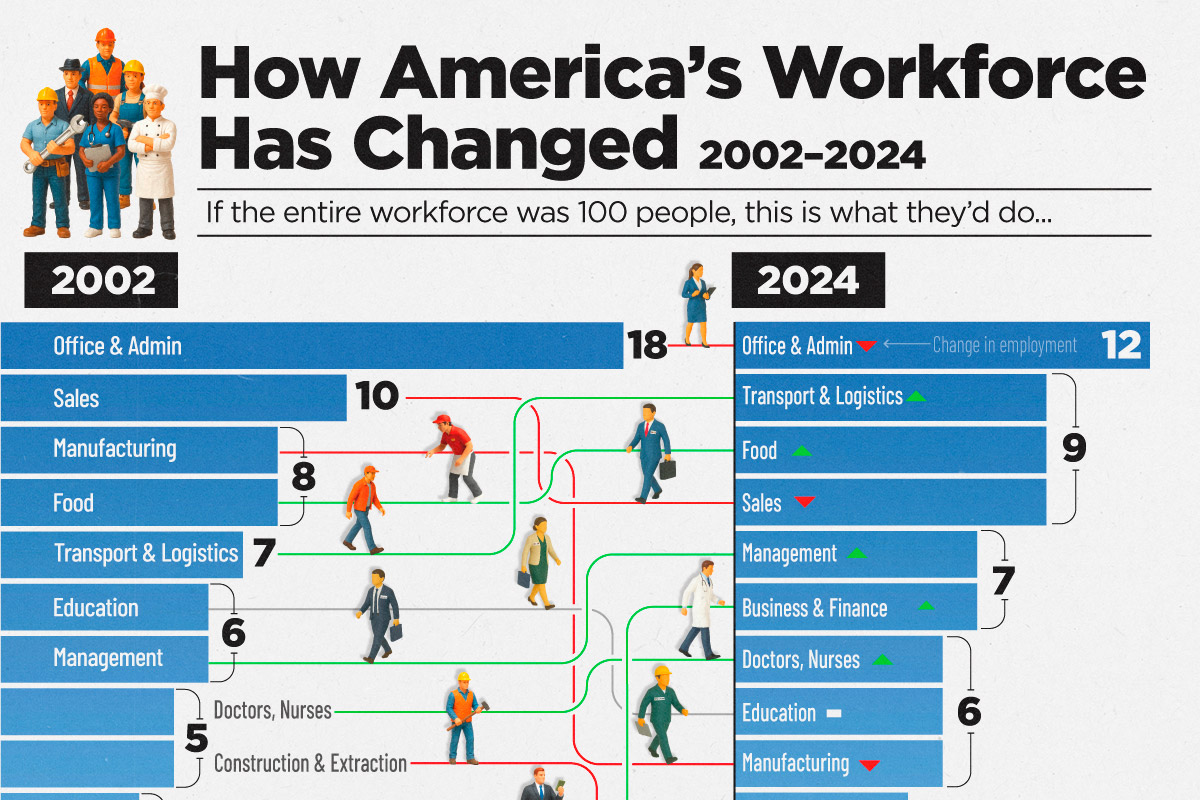
Two decades ago, nearly one in five American workers answered phones, filed paperwork, or managed calendars.
Today, that figure has fallen sharply.
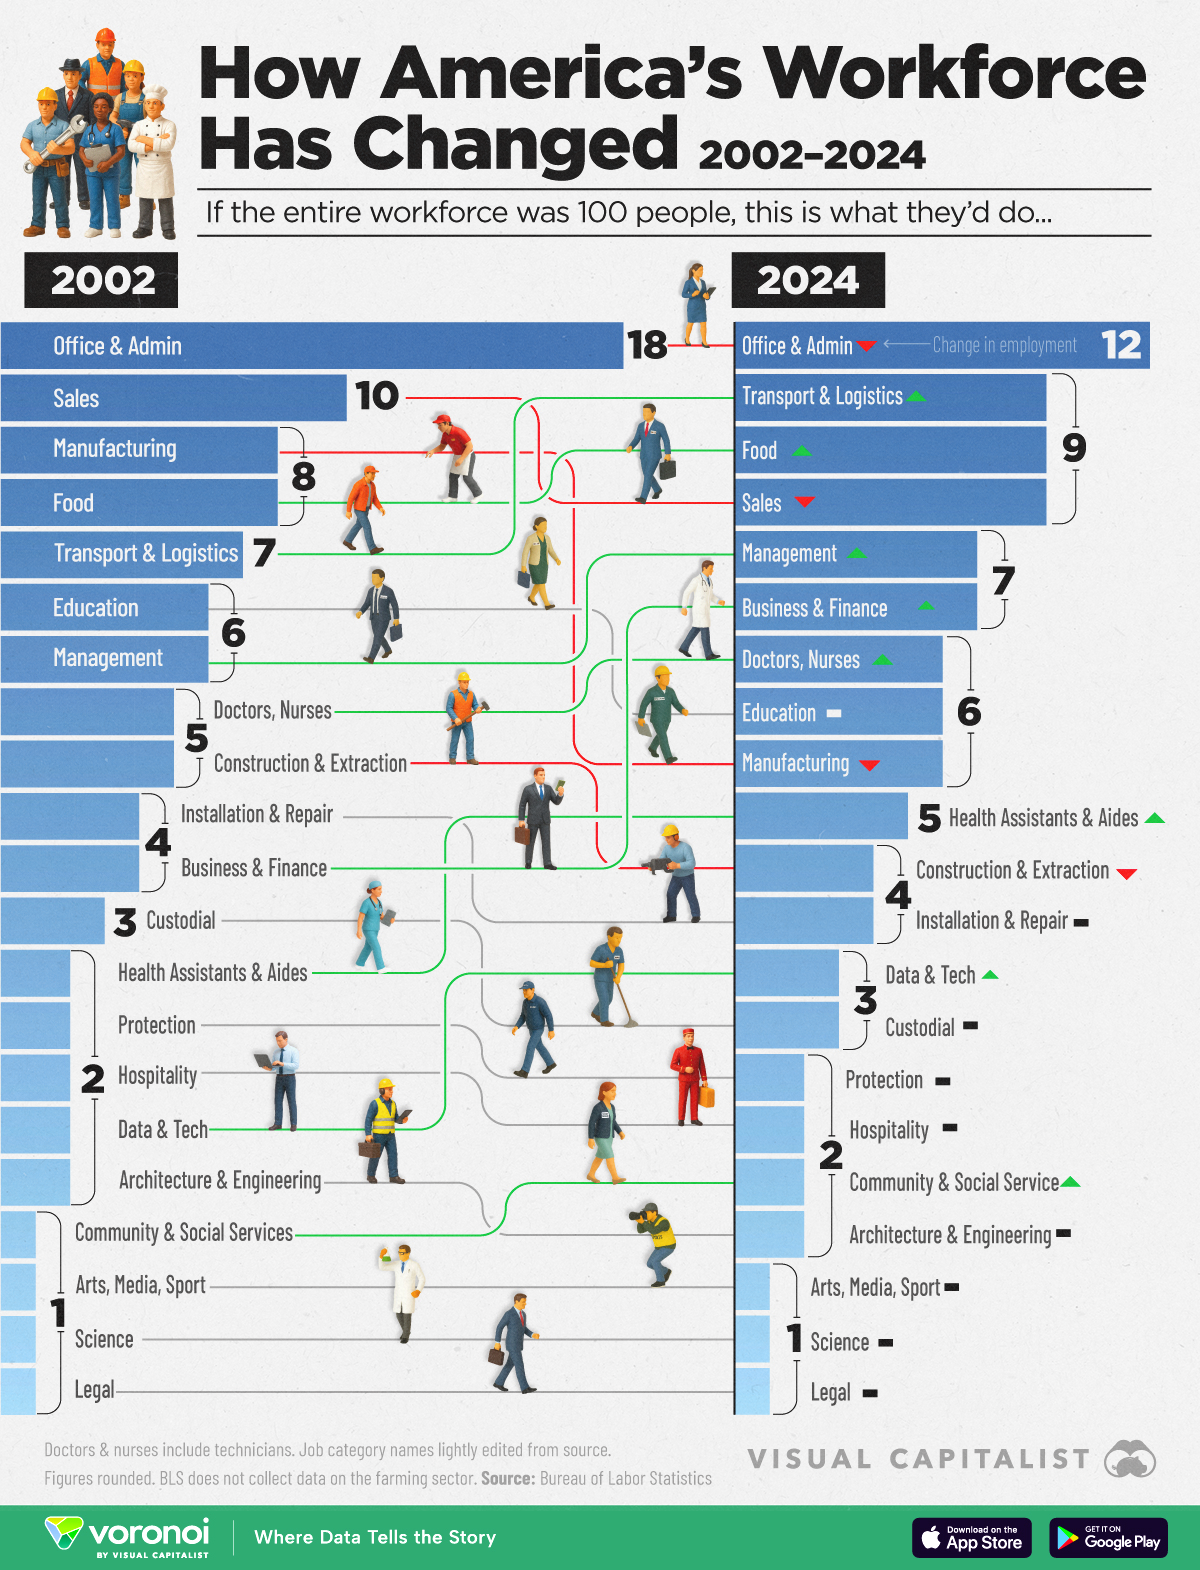
The visualization compares how 100 hypothetical workers were distributed across occupations in 2002 versus 2024. It revealing which fields lost—or gained—share during a period marked by globalization, new technology, and a pandemic.
The data for this visualization comes from the U.S. Bureau of Labor Statistics’ Occupational Employment and Wage Statistics, which track headcounts across more than 800 detailed job categories.
Those categories are grouped into 21 broad buckets, visualized here, to spotlight long-term structural shifts in U.S. jobs.
Office Work is Still the Most Common U.S. Job
Back-office roles were once the backbone of white-collar employment.
But widespread adoption of enterprise software—from automated invoicing to cloud-based scheduling—has pared back demand.