Mapped: The World’s Countries, by Income Group
Globally, the share of low income countries has declined significantly over the past quarter century, dropping from 30.7% in 2000 to just 11.9% today.
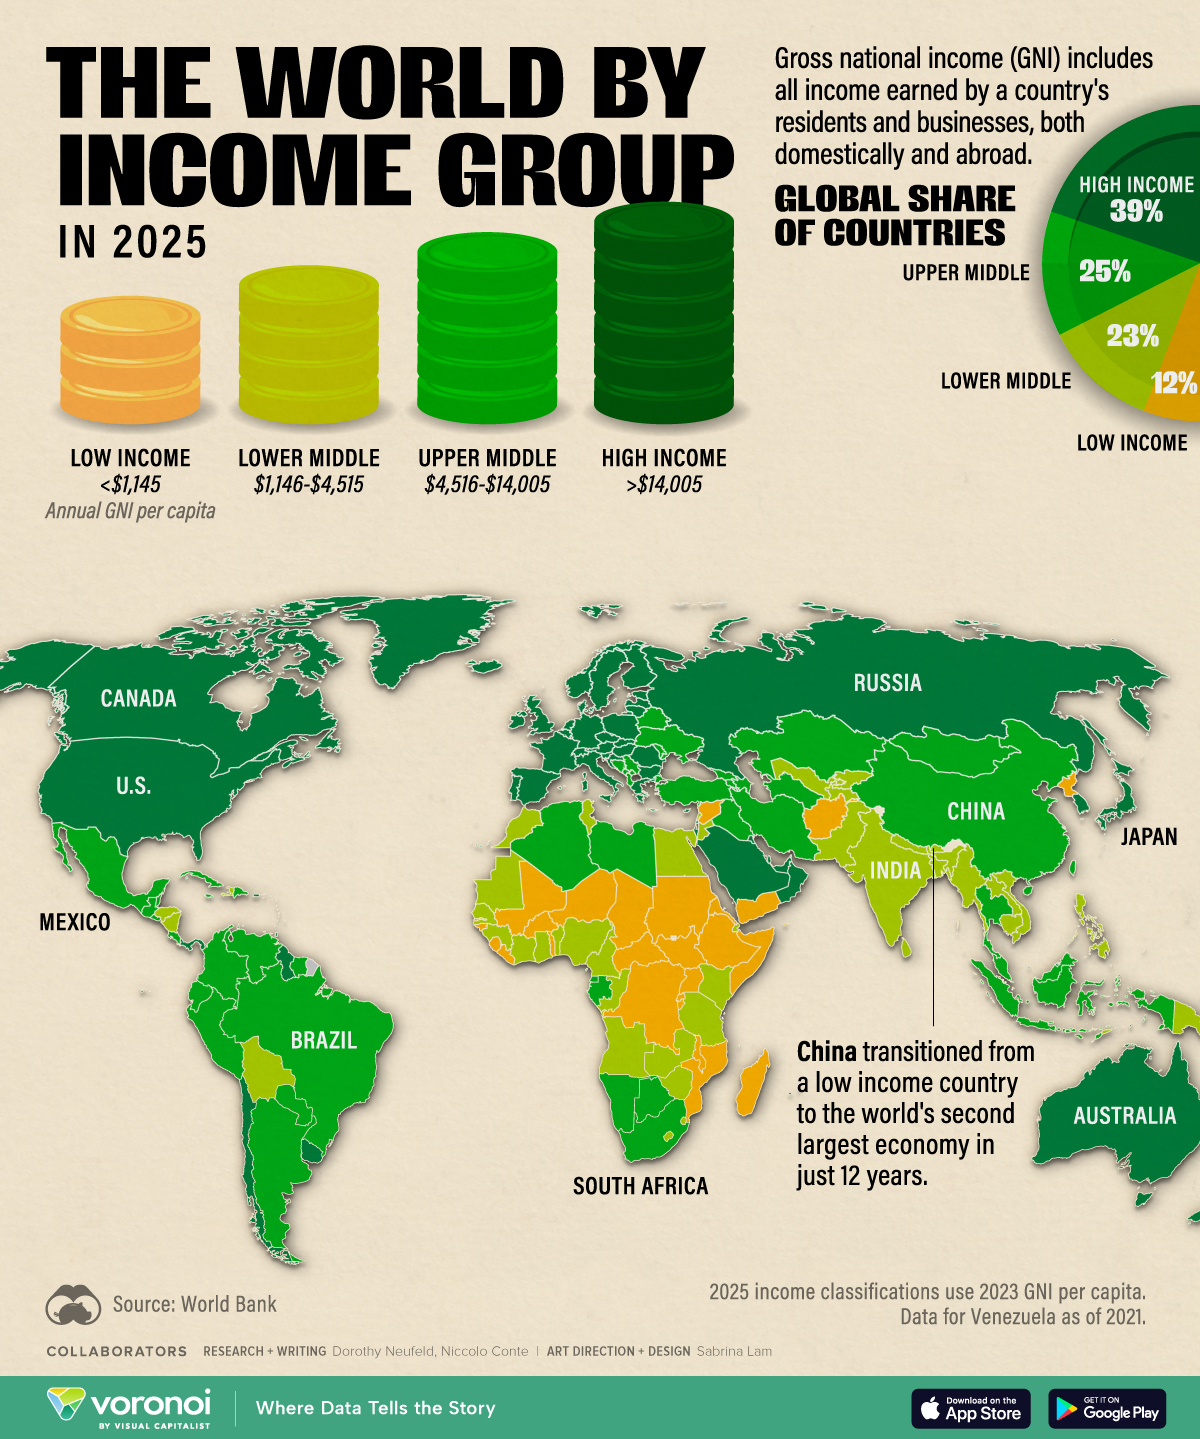
China transitioned out of a low income country in 1999 and, by 2010, had achieved upper middle-income status, a position it continues to hold. Similarly, India, which was a low income country two decades ago, has grown into a middle income country driven by rapid economic growth.
This graphic shows countries by gross national income (GNI) per capita, based on data from the World Bank.
Breaking Down Countries by Income Classification
For country income classifications, the World Bank used GNI per capita, which includes all income earned by a country’s residents and businesses, both domestically and abroad .
Below, we show how 218 countries worldwide fall into each income category:
| Income Group | GNI per Capita 2025 | Global Share of Countries |
|---|---|---|
| Low income | $1,145 or less | 11.9% |
| Lower middle income | $1,146 to $4,515 | 23.4% |
| Upper middle income | $4,516 to $14,005 | 25.2% |
| High income | $14,005 or more | 39.4% |
Today, 86 countries are considered high income, amounting to 39.4% of the share of countries worldwide.
Since 2000, this share has risen notably from 25.4% of the global total. In Europe, the former Eastern Bloc countries of Hungary, Poland, Czechia, and Slovakia transitioned into high income countries supported by market reforms and income growth.
Meanwhile, Chile and Uruguay ascended to high income status driven by a 2000s commodities boom and rising GDP per capita. Chile stands as the world’s largest copper producer and the second largest producer of lithium.
In Asia, South Korea’s economic rise stemmed from vast exports to China and specialization in key industries. Over the past 25 years, it is among the few countries in the region to overcome the ‘middle-income trap’.
A Closer Look at Income Classification by Region
When looking at income classification from a regional perspective, we can see that high income countries are becoming more prevalent across key regions:
| Region | Share of High Income Countries | Share of Upper Middle Icome Countries | Share of Lower Middle Income Countries | Share of Low Income Countries | Number of Countries |
|---|---|---|---|---|---|
| North America | 100.0% | 0.0% | 0.0% | 0.0% | 3 |
| Europe & Central Asia | 69.0% | 25.9% | 5.2% | 0.0% | 58 |
| Latin America & Caribbean | 42.9% | 47.6% | 9.5% | 0.0% | 42 |
| East Asia & Pacific | 42.1% | 23.7% | 31.6% | 2.6% | 38 |
| Middle East & North Africa | 38.1% | 19.0% | 33.3% | 9.5% | 21 |
| Sub-Saharan Africa | 2.1% | 12.5% | 39.6% | 45.8% | 48 |
| South Asia | 0.0% | 12.5% | 75.0% | 12.5% | 8 |
Overall, 42.9% of countries in Latin America and the Caribbean are high income, mostly found across island nations.
In the Middle East, oil-rich nations of Qatar, Saudi Arabia, and the UAE have among the highest GDP per capita in the region. Notably, Saudi Arabia emerged as the region’s first trillion-dollar economy fueled by massive oil reserves and government initiatives.
By contrast, Sub-Saharan Africa and South Asia have the lowest share of wealthy countries, yet growth in key countries has been promising. In 2024, Sub-Saharan Africa was home to nine of the top 20 fastest-growing economies including Niger, Senegal, and Libya.
Información extraída de: https://www.visualcapitalist.com/the-world-countries-by-income-group/