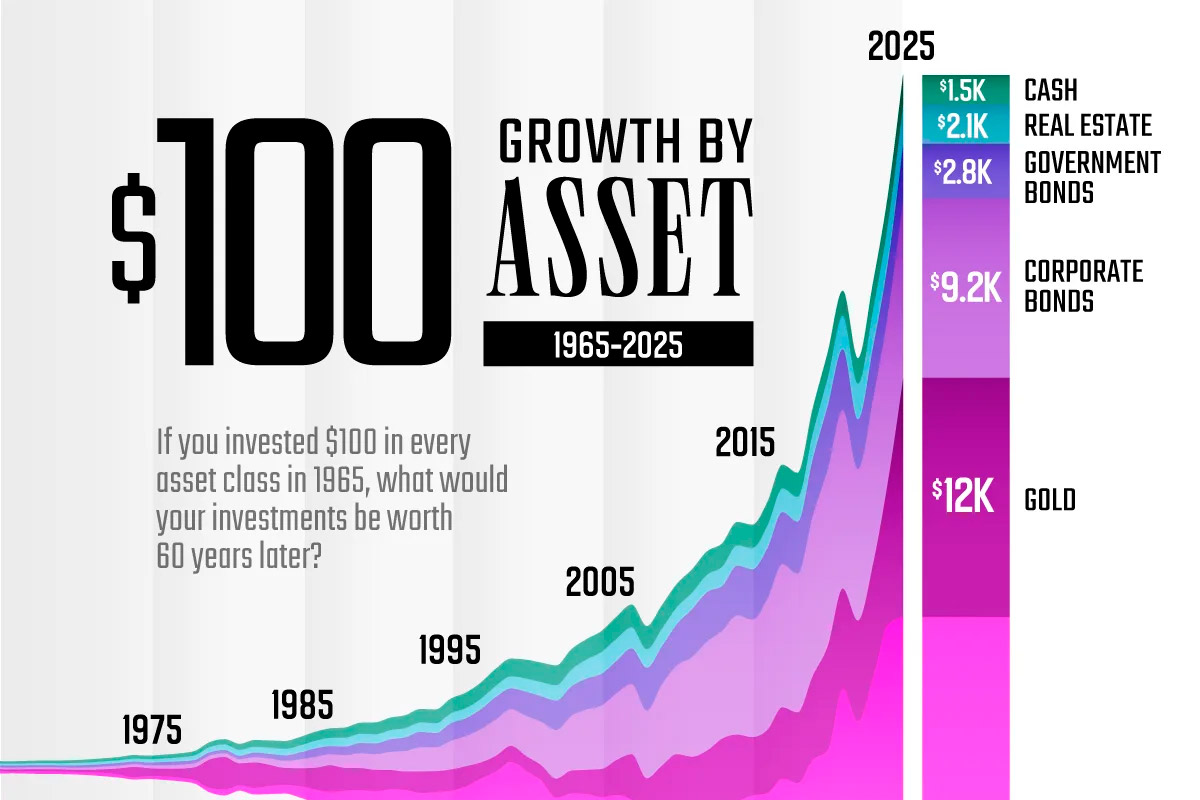

Charted: The Growth of $100 by Asset Class (1965–2025)
What would $100 invested in 1965 be worth today? For stocks, it would’ve multiplied 435 times, but other asset classes have significantly lower returns.
Here’s how each asset class performed over 60 years, based on data from NYU Stern professor Aswath Damodaran.
Stocks reflect S&P 500 total returns with dividends reinvested, real estate follows the Case-Shiller Home Price Index (price only), and cash represents three-month U.S. Treasury bills.
Stocks Outperform Other Asset Classes Since 1965
The table below shows the nominal (before inflation) returns of a $100 investment across six major asset classes between 1965 and 2025, with values representing the investment’s value at year-end:
|
Year
|
Stocks
|
Gold
|
Corporate Bonds
|
Government Bonds
|
Real Estate
|
Cash
|
|---|---|---|---|---|---|---|
| 1965 | $112 | $100 | $103 | $101 | $102 | $104 |
| 1966 | $101 | $100 | $100 | $104 | $103 | $109 |
| 1967 | $125 | $100 | $101 | $102 | $105 | $114 |
| 1968 | $139 | $112 | $105 | $105 | $110 | $120 |
| 1969 | $127 | $118 | $103 | $100 | $117 | $128 |
| 1970 | $132 | $106 | $109 | $117 | $127 | $136 |
| 1971 | $151 | $124 | $124 | $128 | $132 | $142 |
| 1972 | $179 | $185 | $139 | $132 | $136 | $148 |
| 1973 | $153 | $320 | $145 | $137 | $141 | $158 |
| 1974 | $114 | $531 | $138 | $139 | $155 | $170 |
| 1975 | $156 | $400 | $153 | $144 | $166 | $180 |
| 1976 | $193 | $383 | $184 | $168 | $179 | $189 |
| 1977 | $179 | $470 | $202 | $170 | $205 | $199 |
| 1978 | $191 | $644 | $208 | $168 | $238 | $213 |
| 1979 | $226 | $1,459 | $204 | $170 | $270 | $235 |
| 1980 | $298 | $1,680 | $197 | $164 | $290 | $262 |
| 1981 | $284 | $1,132 | $214 | $178 | $305 | $298 |
| 1982 | $342 | $1,309 | $276 | $236 | $307 | $331 |
| 1983 | $419 | $1,089 | $321 | $244 | $322 | $361 |
| 1984 | $444 | $878 | $371 | $277 | $337 | $397 |
Stocks can build wealth faster than other major assets because company profits tend to grow over time, dividends can be reinvested, and returns compound.
The trade-off is risk and volatility as stock prices can swing sharply up and down.
In this 60-year window, a large share of equity gains happened during two major bull cycles.
Two big bull runs drove most stock gains: 1982–2000 (about 17x) and the post-2008 rebound (about 10x), so missing either one could’ve significantly dampened investment returns.
How Drawdowns and Recoveries Affect Returns
Every asset class has faced major drawdowns and recoveries, but stocks were often the fastest to recover.
In 2008, equities fell 37% in a single year, then rebounded to new highs in roughly four years as aggressive Fed support steadied markets.
After the COVID-19 shock, bonds—long seen as a safe haven—suffered their worst two-year stretch in decades.
Gold saw the longest dry spell: after its 1980 peak, it took 26 years just to break even as high real rates and a strong dollar dragged on returns. Once it finally cleared that level, it nearly doubled again by 2011.
Real estate also took time after its major drawdown—after the housing bust in 2008/2009, prices needed about a decade to fully recover.
Together, these cycles show that while no asset class is immune to deep losses, recovery timelines can vary dramatically—and patience often matters as much as diversification.
Información extraída de: https://www.visualcapitalist.com/charted-the-growth-of-100-by-asset-class-1965-2025/