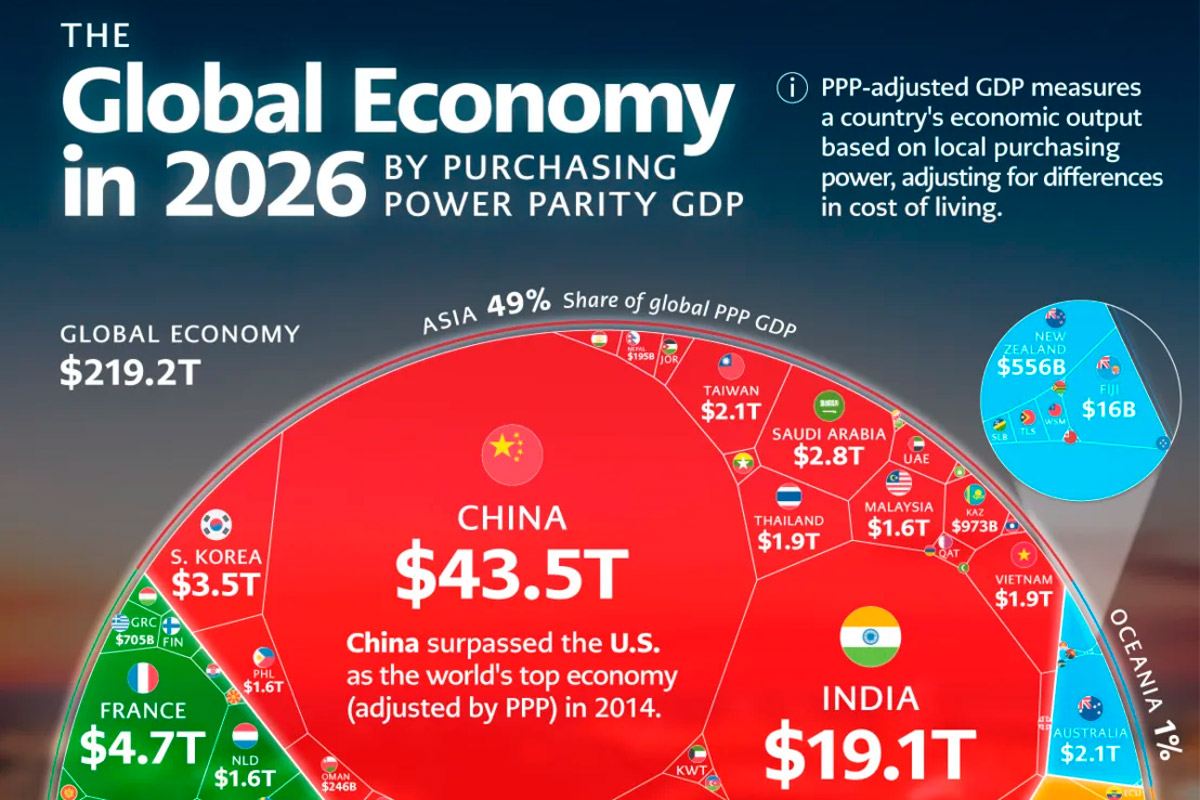

The Entire Global Economy in 2026 in One Chart (GDP, PPP)
The global economy is worth roughly $219 trillion in 2026 when measured by purchasing power parity (PPP), which adjusts economic output for differences in cost of living.
This visualization shows the size of every country’s economy using PPP-adjusted GDP, making it easier to compare how national economies stack up around the world.
These projections for 2026 come from the International Monetary Fund.
How PPP Changes the Global Economic Rankings
When comparing economies using PPP, the global ranking looks very different from nominal GDP.
While the United States is the world’s largest economy by nominal GDP, when adjusting for PPP China has actually been the world’s dominant economy since 2014.
Today the Chinese economy is valued at $43.5 trillion, well ahead of the $31.8 trillion seen in the United States.
|
Rank
|
Country
|
GDP (PPP, billions of international dollars)
|
|---|---|---|
| 1 | 🇨🇳 China | 43,491.5 |
| 2 | 🇺🇸 United States | 31,821.3 |
| 3 | 🇮🇳 India | 19,143.4 |
| 4 | 🇷🇺 Russia | 7,340.8 |
| 5 | 🇯🇵 Japan | 6,923.3 |
| 6 | 🇩🇪 Germany | 6,323.5 |
| 7 | 🇮🇩 Indonesia | 5,358.3 |
| 8 | 🇧🇷 Brazil | 5,161.1 |
| 9 | 🇫🇷 France | 4,657.2 |
| 10 | 🇬🇧 United Kingdom | 4,592.1 |
| 11 | 🇹🇷 Turkey | 3,976.1 |
| 12 | 🇮🇹 Italy | 3,815.9 |
| 13 | 🇲🇽 Mexico | 3,552.7 |
| 14 | 🇰🇷 South Korea | 3,486.5 |
| 15 | 🇪🇸 Spain | 2,935.7 |
China is far from alone in representing Asia among the world’s largest economies, however. Asian countries today contribute 49% of the global economy, solidifying the continent’s place as the new center of international trade and production.
India is the third-largest PPP-adjusted economy worldwide, at $19.1 trillion, while Japan ($6.9 trillion), Indonesia ($5.4 trillion), and South Korea ($3.5 trillion) all see multi-trillion-dollar boosts compared to their nominal GDP owing to cheaper costs of living.
At 4.7 billion people, Asia is the most populous continent worldwide, and many of its smaller developing economies, such as Vietnam and Thailand (both $1.9 trillion), are expected to continue to grow rapidly in the coming years, indicating the continent’s continued dominance going forward.
The European Gap
If there’s one region where the difference between nominal and PPP-adjusted GDP is felt, it’s Europe. By nominal standards, Germany is the largest economy on this continent, followed by the United Kingdom, France, Italy, and Russia.
However, when adjusting for relative purchasing power Russia sees a massive boost, as a cheaper overall country, and soars to become Europe’s top economy at $7.3 trillion. By this metric, in fact, Russia is fourth worldwide behind only China, the U.S., and India.
France also surpasses the United Kingdom in this regard, but by and large the Eurozone economies fall behind Asian peers like Indonesia or Japan, which are able to acquire or produce goods at a more competitive rate.
The Boon of Emerging Markets
Outside of Eurasia, the story for emerging markets is much of the same. Brazil ($5.2 trillion) and Mexico ($3.6 trillion) each leapfrog Canada ($2.8 trillion) to become the second- and third-largest economies of the Americas, respectively.
Meanwhile, in Africa, home to a mere six percent of global GDP share, the three emerging-market economies of Egypt, Nigeria, and South Africa are responsible for roughly $6 trillion in total PPP-adjusted economic output.
Información extraída de: https://www.visualcapitalist.com/the-global-economy-by-ppp-2026/