
U.S. Latino GDP vs. Global Economic Powers
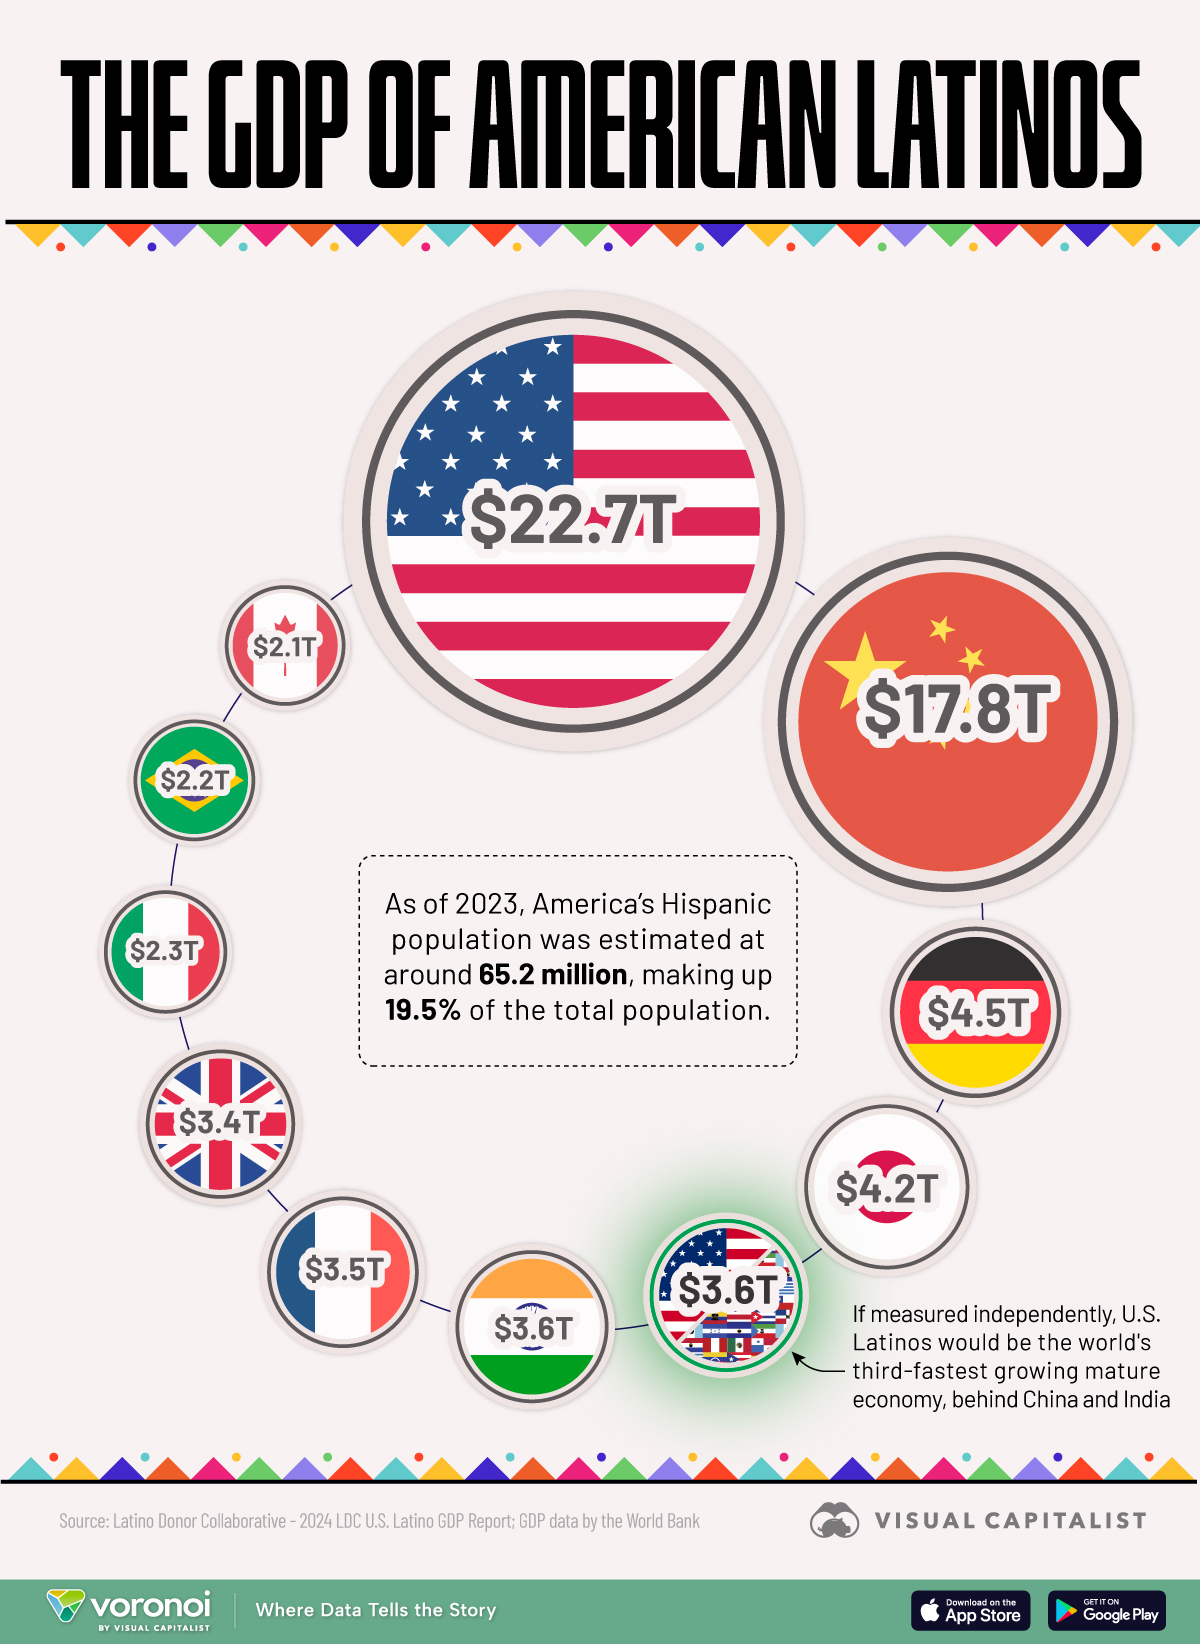
In 2024, the U.S. Latino GDP reached a record $3.6 trillion, making it the fifth-largest economy in the world if measured independently. This figure places it ahead of global powerhouses like India, the United Kingdom, and France.
In this graphic we show the power of the U.S. Latino economy compared to major economies. The data comes from the Latino Donor Collaborative Think Tank.
A Growing Economic Force
The U.S. Latino economy is not only massive—it’s fast-growing. In fact, it ranks as:
#1 fastest-growing segment of the U.S. economy
#3 fastest-growing mature economy globally, trailing only China and India
Manufacturing Leads the Way
Manufacturing is the largest sector in the U.S. Latino economy, contributing $457.4 billion, or 17% of total U.S. manufacturing output. It’s a strategic industry at a time when the Trump administration is actively working to bring more industrial production back to American soil.
| Country | GDP (2024) |
|---|---|
| 🇺🇸 U.S. | $27.7T |
| 🇨🇳 China | $17.8T |
| 🇩🇪 Germany | $4.5T |
| 🇯🇵 Japan | $4.2T |
| 🇺🇸 U.S. Latino | $3.6T |
| 🇮🇳 India | $3.6T |
| 🇫🇷 France | $3.5T |
| 🇬🇧 UK | $3.4T |
| 🇮🇹 Italy | $2.3T |
| 🇧🇷 Brazil | $2.2T |
| 🇨🇦 Canada | $2.1T |
Latino purchasing power now stands at $3.78 trillion—and it’s expanding rapidly. Over the past decade, Latino income growth has outpaced that of non-Latinos by more than double, with annualized growth of 4.8% compared to 1.8%. Latino consumption and purchasing power have also grown 2.5 times faster than their non-Latino counterparts.
A Young and Expanding Workforce
From 2017 to 2022, the number of high-income Latino earners increased six times faster than that of non-Latinos. If current trends continue, nearly 39% of all new high-income earners over the next decade will be U.S. Latinos.
Información extraída de: https://www.visualcapitalist.com/u-s-latino-gdp-vs-global-economic-powers/