The world has seen a record surge in immigration over the last three years, with 15 million people migrating for various reasons, from economic opportunity to political instability.
In this week’s VC+ Special Dispatch, we visualize key trends in global migration flows with a focus on U.S. immigration, including:
- 🌏 A regional breakdown of net migration and its impact on the economy
- 🇺🇸 A list of the most common U.S. immigrants by nationality
- ❓A look at America’s 11.2M unauthorized immigrants and where they come from
VC+ is our premium offering and members receive a new Special Dispatch every week.
Diving Into the Numbers of Immigration and Migration
Below, you’ll see a glimpse of some of the visuals we’ll be covering, however the full feature will contain many more charts and exclusive analysis you’ll only find at VC+.
For now, keep scrolling to get a sneak preview of our Special Dispatch.
Chart Preview: Top Countries Losing People to Emigration
We look at the countries with the largest outflows of people in 2023, with those experiencing violent conflict and economic uncertainty being most likely to have the highest net emigration.

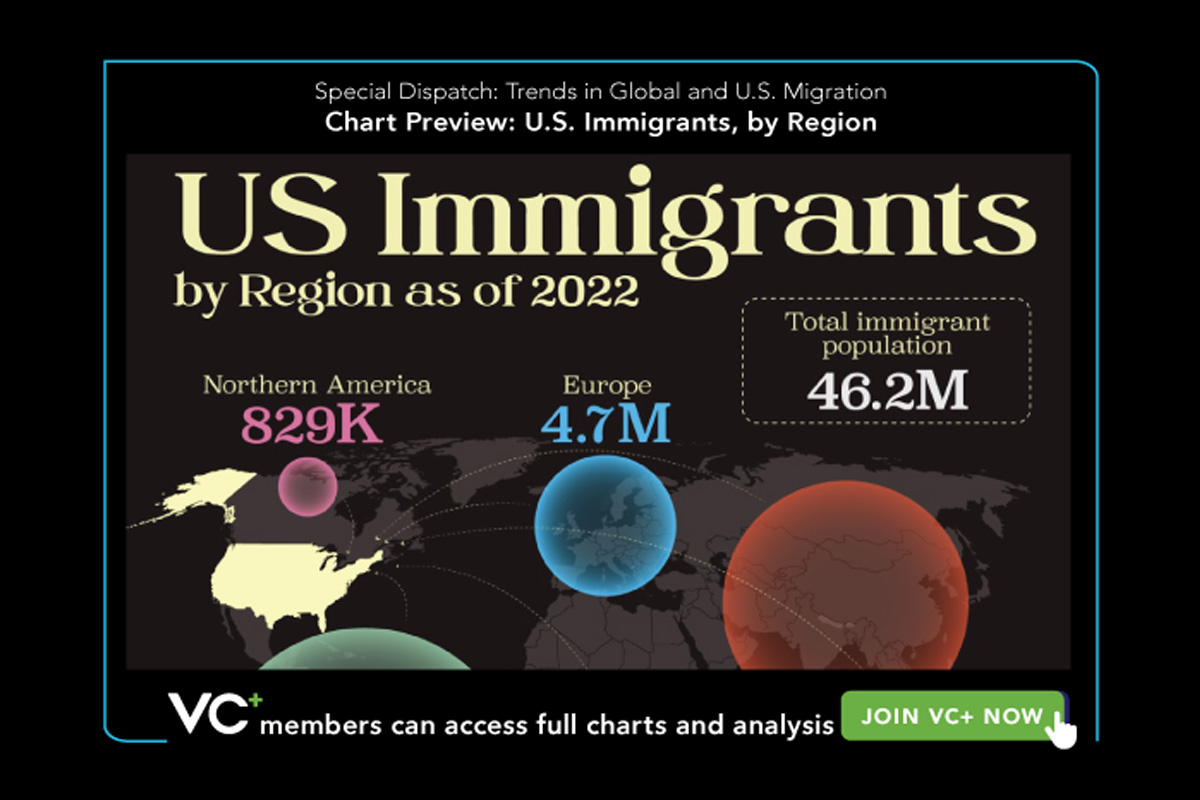
Chart Preview: U.S. Immigrants, by Region
We look at a breakdown of where U.S. immigrants originate from, searching for patterns that may echo wider global trends.

Chart Preview: Why Immigrants Come to the United States
We explore the primary reasons behind immigration to the U.S. and how they may vary depending on the person’s home country.
Información extraída de: https://www.visualcapitalist.com/special-dispatch-migration/


