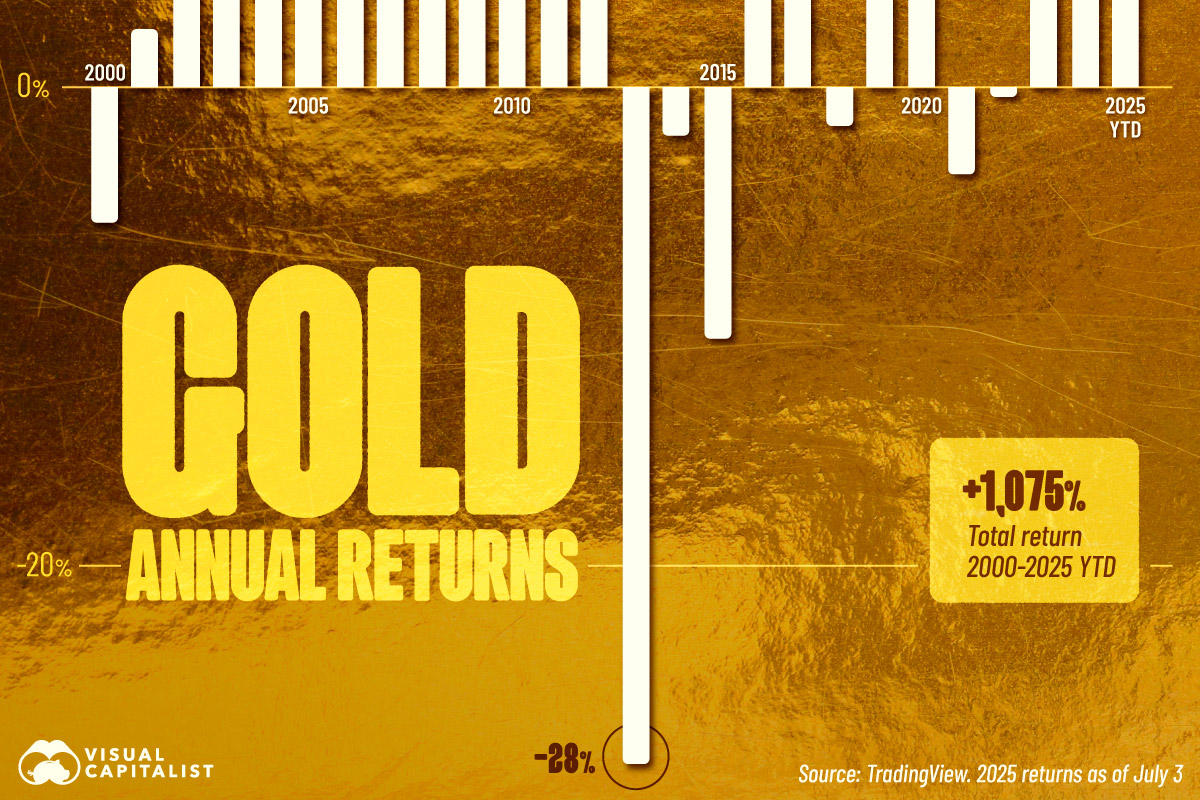
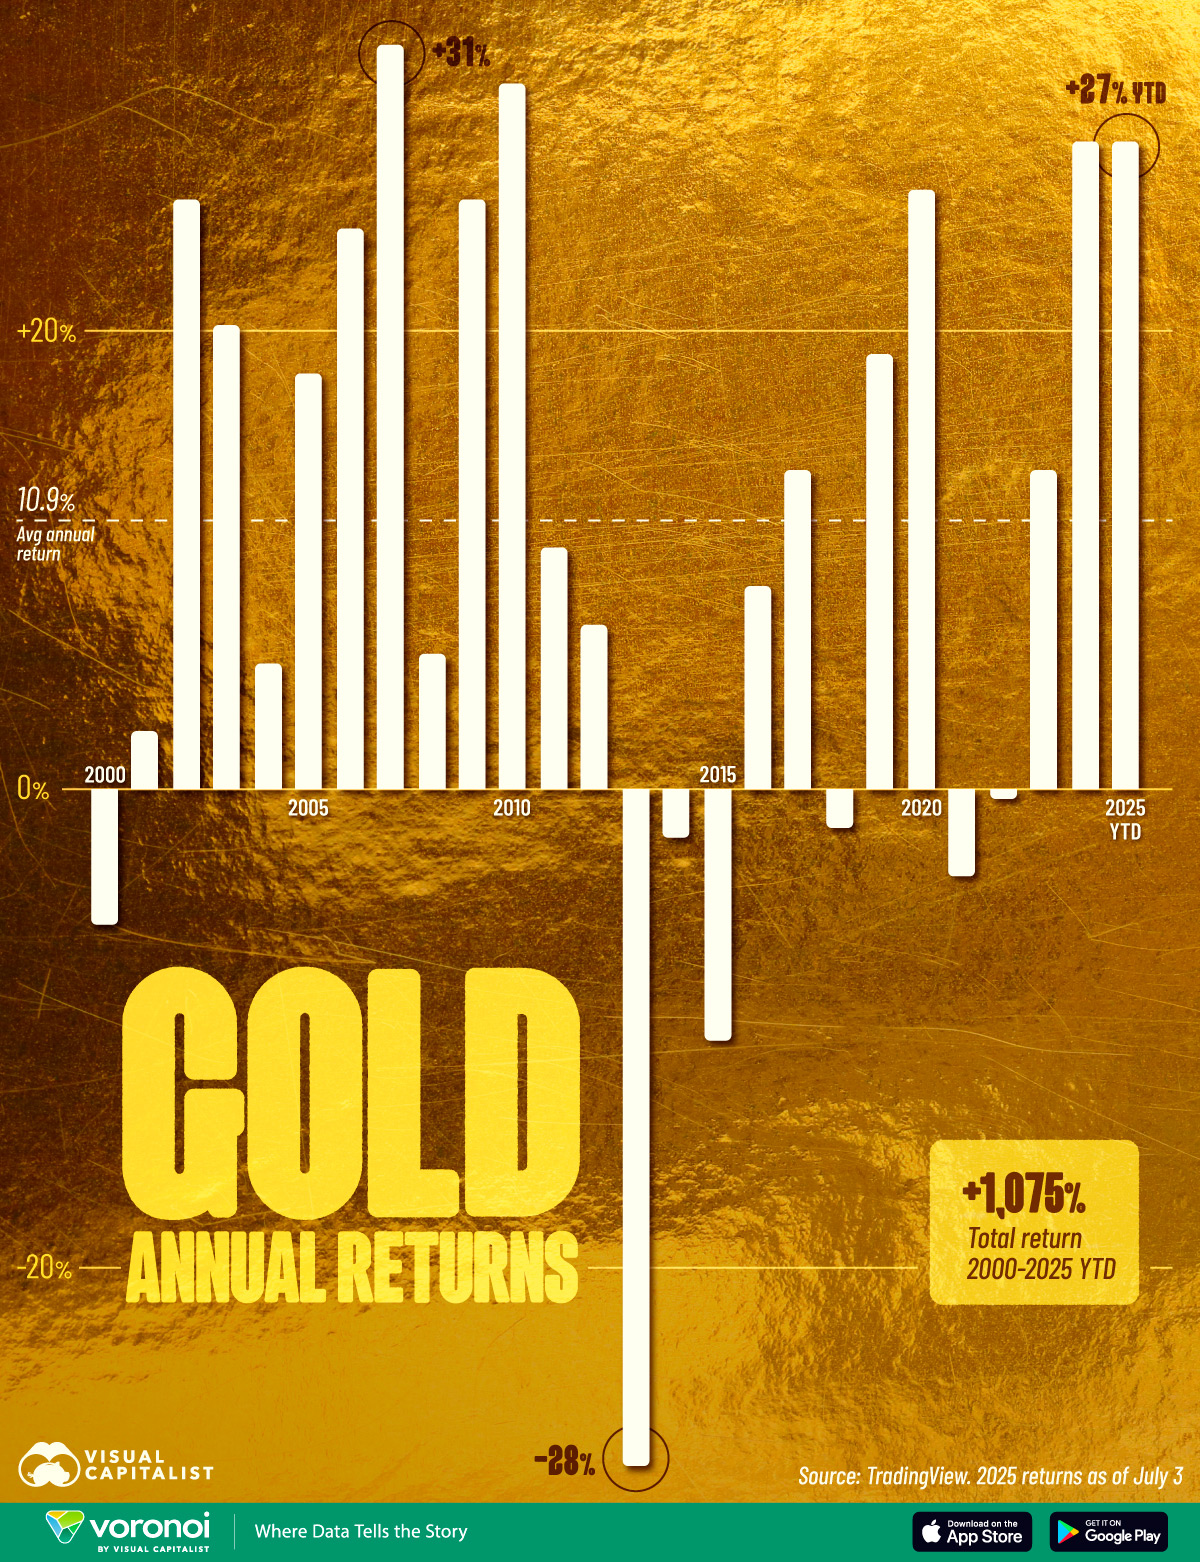
Visualized: Gold’s Annual Returns from 2000 to 2025 YTD
Over the last 25 years, gold has been a relatively stable asset class for investors looking for diversification, a hedge against inflation, or a safe haven in uncertain times.
From 2000 to 2025, the precious metal has delivered a staggering 1,075% return for patient investors.
This chart shows the annual returns of gold from 2000 through 2025 (YTD as of July 3), based on data from TradingView.
Gold Shines When It Rains
On average across the 25 years, gold’s price has increased by 10.9% annually, although it has seen some volatility.
Here’s how gold has performed every year from 2000 to 2025: