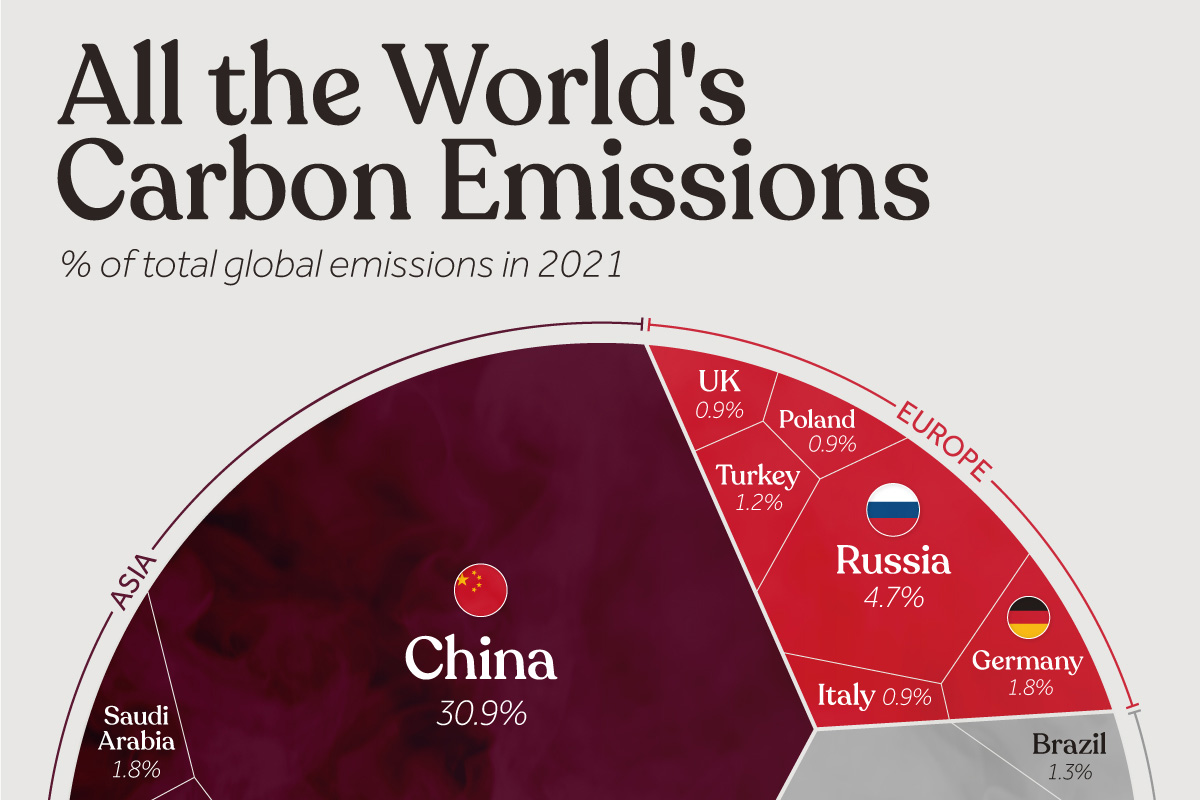
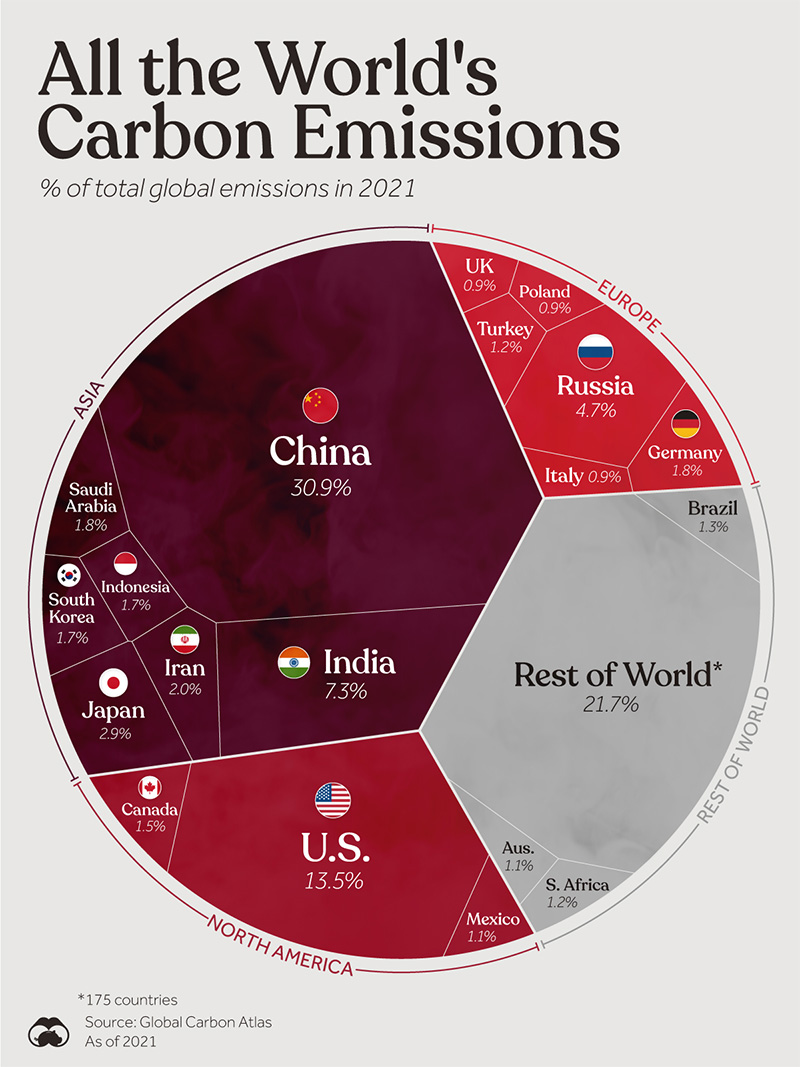
Visualizing All The World’s Carbon Emissions By Country
The greenhouse effect, essential for sustaining Earth’s life-friendly temperatures, has been intensified by burning fossil fuels.
This amplification of the natural greenhouse effect has led to significant alterations to the planet’s climate system.
The graphic above uses data from the Global Carbon Atlas to explore which countries contribute the most to CO₂ emissions.
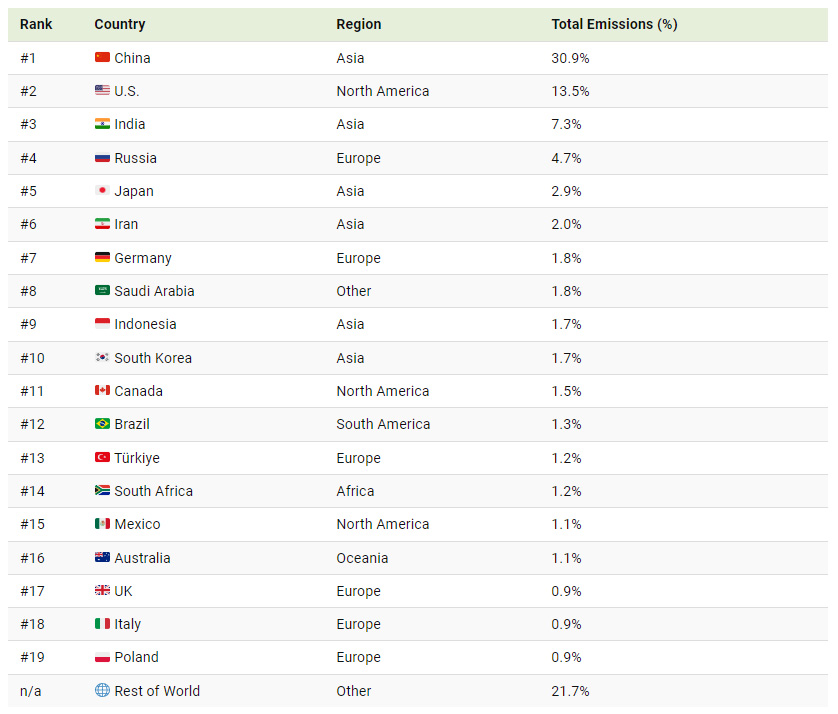
Ranked: Global CO₂ Emissions by Country
According to the Global Carbon Atlas, the world’s top polluters are China, India, and the U.S., which accounted for 52% of the world’s CO₂ in 2021.
These countries are also the biggest in terms of population.
In terms of CO₂ emissions per capita (metric tons), the U.S. is relatively high at 15.32, while China and India rank lower at 7.44 and 1.89, respectively.
Historically, the U.S. has been the largest carbon emitter, releasing 422 billion metric tons of CO₂ into the atmosphere since the Industrial Revolution. This is equivalent to almost a quarter of all CO₂ produced from fossil fuels and industrial activities.
Given their massive populations and the fact that countries typically increase their emissions as they become more developed, China and India may continue to grow their shares even further. The International Energy Agency (IEA) forecasts that India’s share of global emissions could rise to 10% by 2030.
All of these major contributors of carbon to the atmosphere have set goals to reduce emissions over the next decades. While the U.S. targets net-zero emissions by 2050, China aims for carbon neutrality by 2060 and India recently set a target of 2070.