Visualizing the Growth of $100, by Asset Class
Which major asset class has generated the strongest returns over the long run? How do the returns of investments like bonds and real estate actually stack up?
To put investment returns in perspective, this graphic shows the growth of $100 by asset class over the long term, based on data from Aswath Damodaran at NYU Stern.
Comparing Asset Class Returns
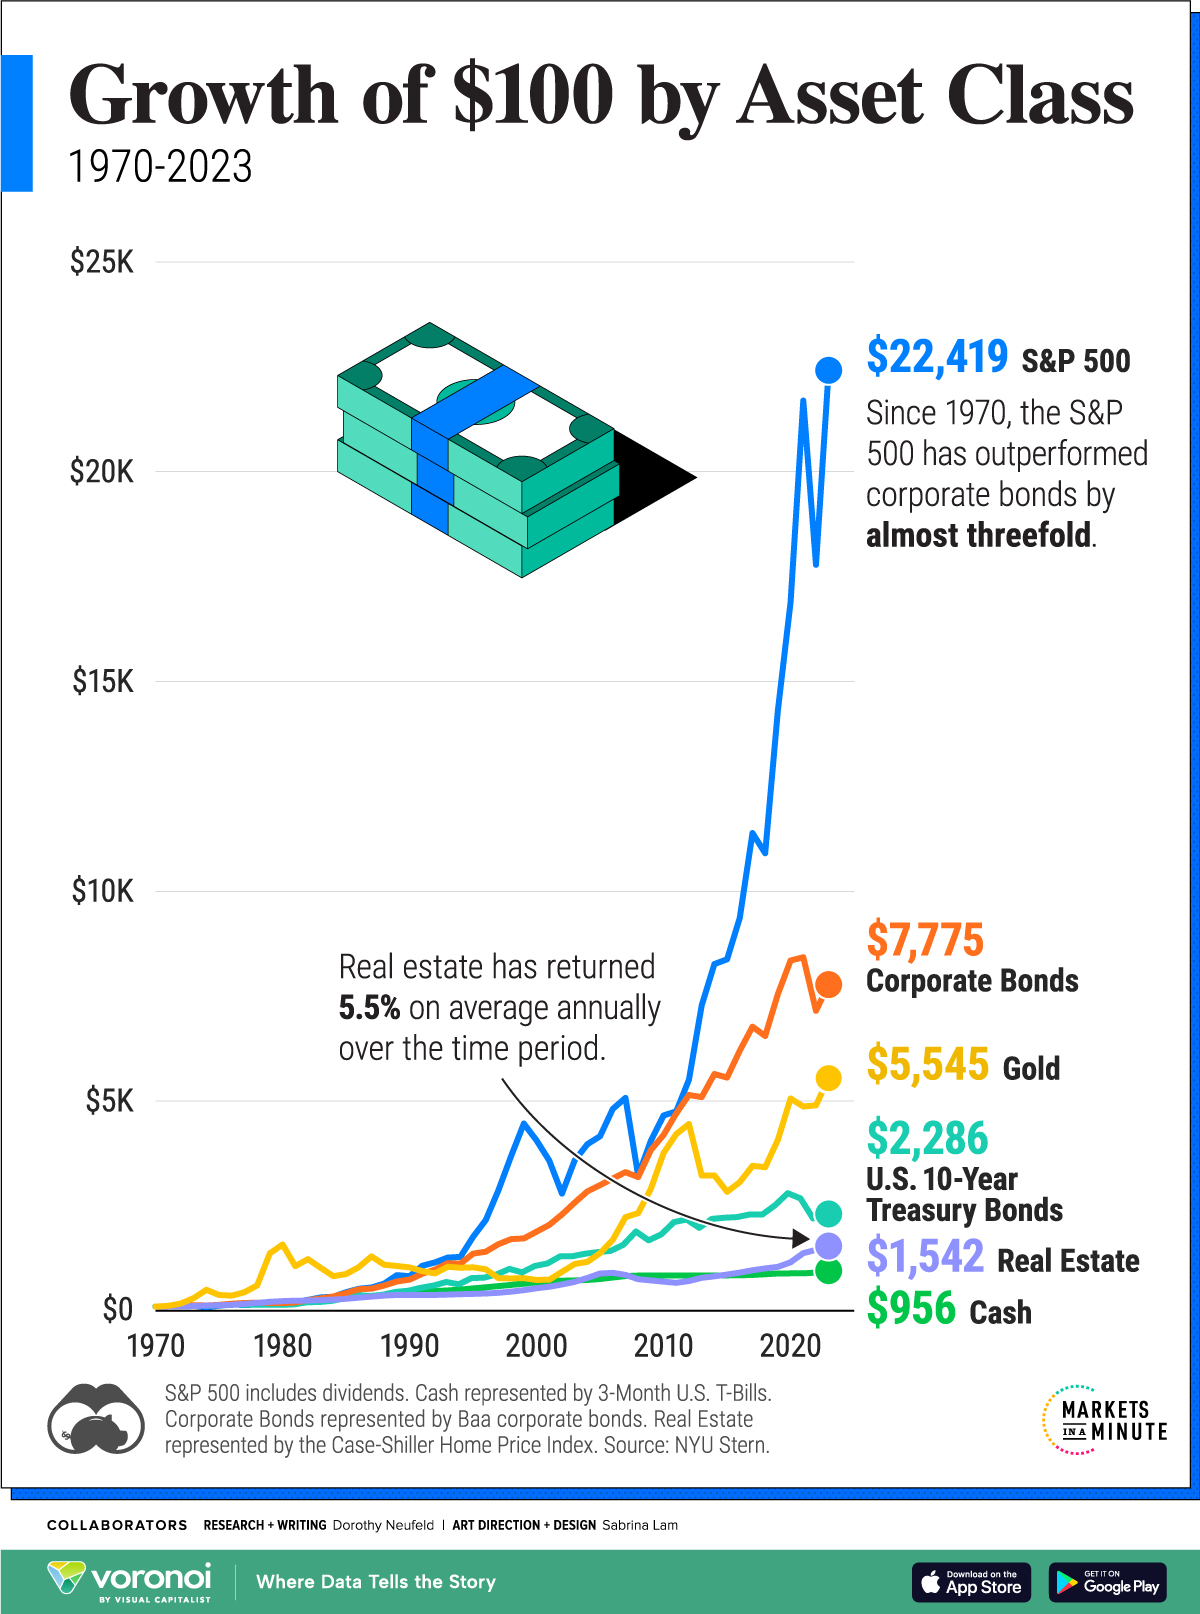
Below, we show the returns of a $100 investment across major asset classes—from U.S. stocks to gold—between 1970 and 2023:
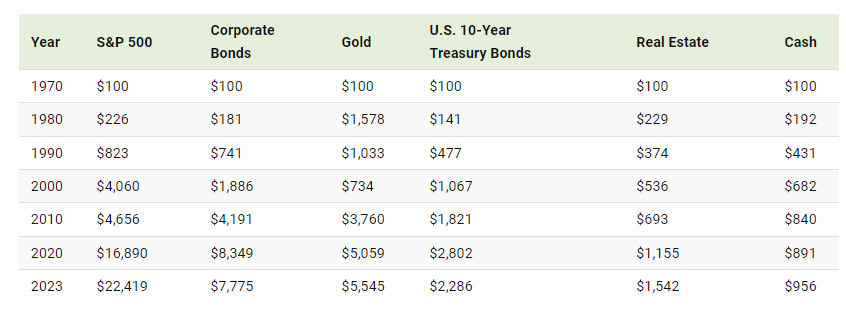
Numbers have been rounded. S&P 500 includes dividends. Cash represented by 3-Month U.S. T-Bills. Corporate Bonds represented by Baa corporate bonds. Real Estate represented by the Case-Shiller Home Price Index.
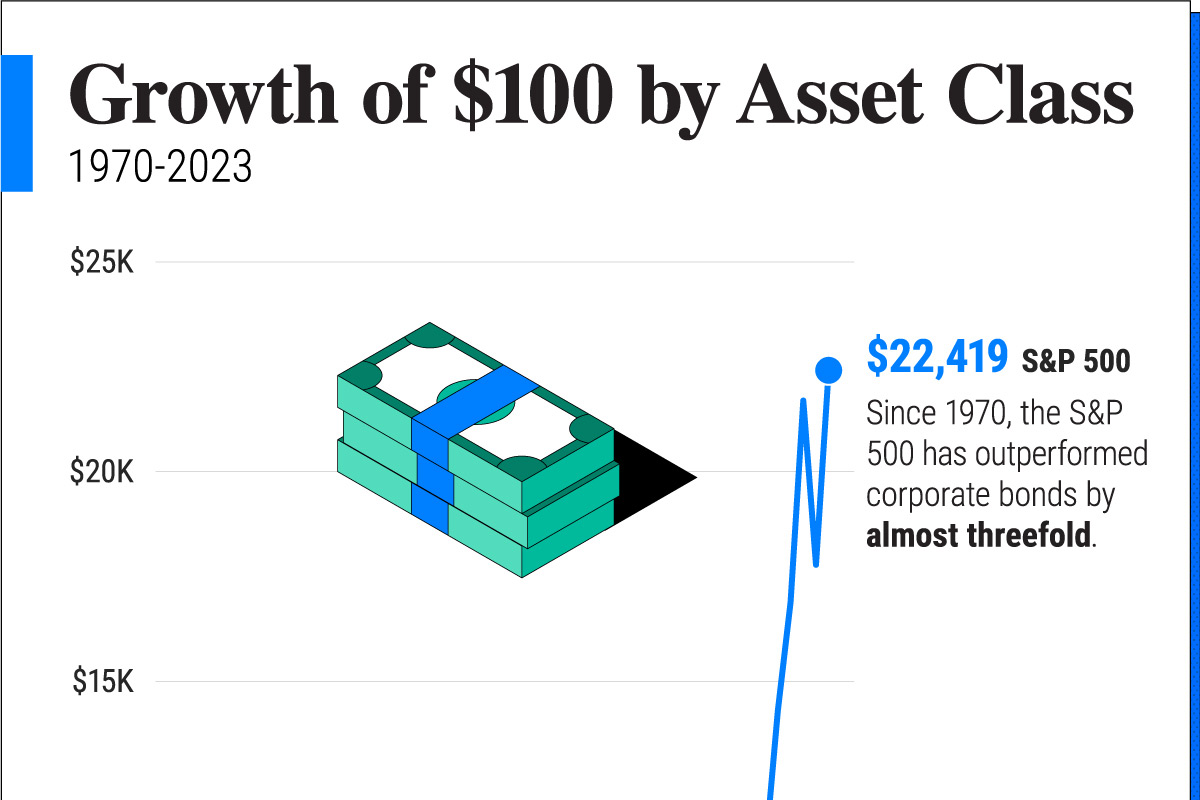
As we can see, a $100 investment in the S&P 500 (including reinvested dividends) in 1970 would be worth an impressive $22,419 in 2023.
Not only were U.S. stocks the top performing major asset class, they outpaced other investments by a wide margin. Consider how a $100 investment in corporate bonds would have grown to $7,775 over the period, or 65% lower than an investment in the S&P 500.
When it comes to gold, a $100 investment would have been worth $5,545 by 2023. During the 1970s and 2000s, gold boomed amid bouts of inflation and a falling U.S. dollar. By comparison, the S&P 500 saw much lower returns over these decades.
Real estate, another safe haven asset, returned on average 5.5% annually since 1970, with the highest gains seen in the decade through 2020. Interestingly, a $100 investment in the asset class would have grown to just $1,542 by 2023 due to slower price growth through the 1980s and 2000s weighing on overall returns.
During both periods, the housing market crashed, taking years for the sector to fully recover. In fact, following the Global Financial Crisis, it took a decade for home prices to climb to their previous 2006 peak.