
Visualizing the Relationship Between Country Size and GDPVisualizing the Relationship Between Country Size and GDPVisualizing the Relationship Between Country Size and GDPVisualizing the Relationship Between Country Size and GDP
  • INICIO
  • SERVICIOS
    • Planeación financiera
    • Ahorro e Inversión
    • Planeación patrimonio familiar
    • Educación financiera
      • Glosario
  • NUESTRAS SOLUCIONES
    • Planeación financiera personalizada
    • Soluciones de ahorro e inversión
    • Planeación patrimonial familiar
    • Soluciones complementarias
  • BLOG
    • Actualidad
    • Ahorro e Inversión
    • Educación Financiera
    • Patrimonio Familiar
    • Pensiones
    • Planeación Financiera
    • Videos
  • NOSOTROS
  • CONTACTO
✕
Mínimo análisis
19 diciembre, 2025
Estos son los 10 principales temores del mercado de cara a 2026
26 diciembre, 2025
Published by grafico@cosmonaut.com.co on 26 diciembre, 2025
Categories
  • Actualidad
Tags

Visualizing the Relationship Between Country Size and GDP

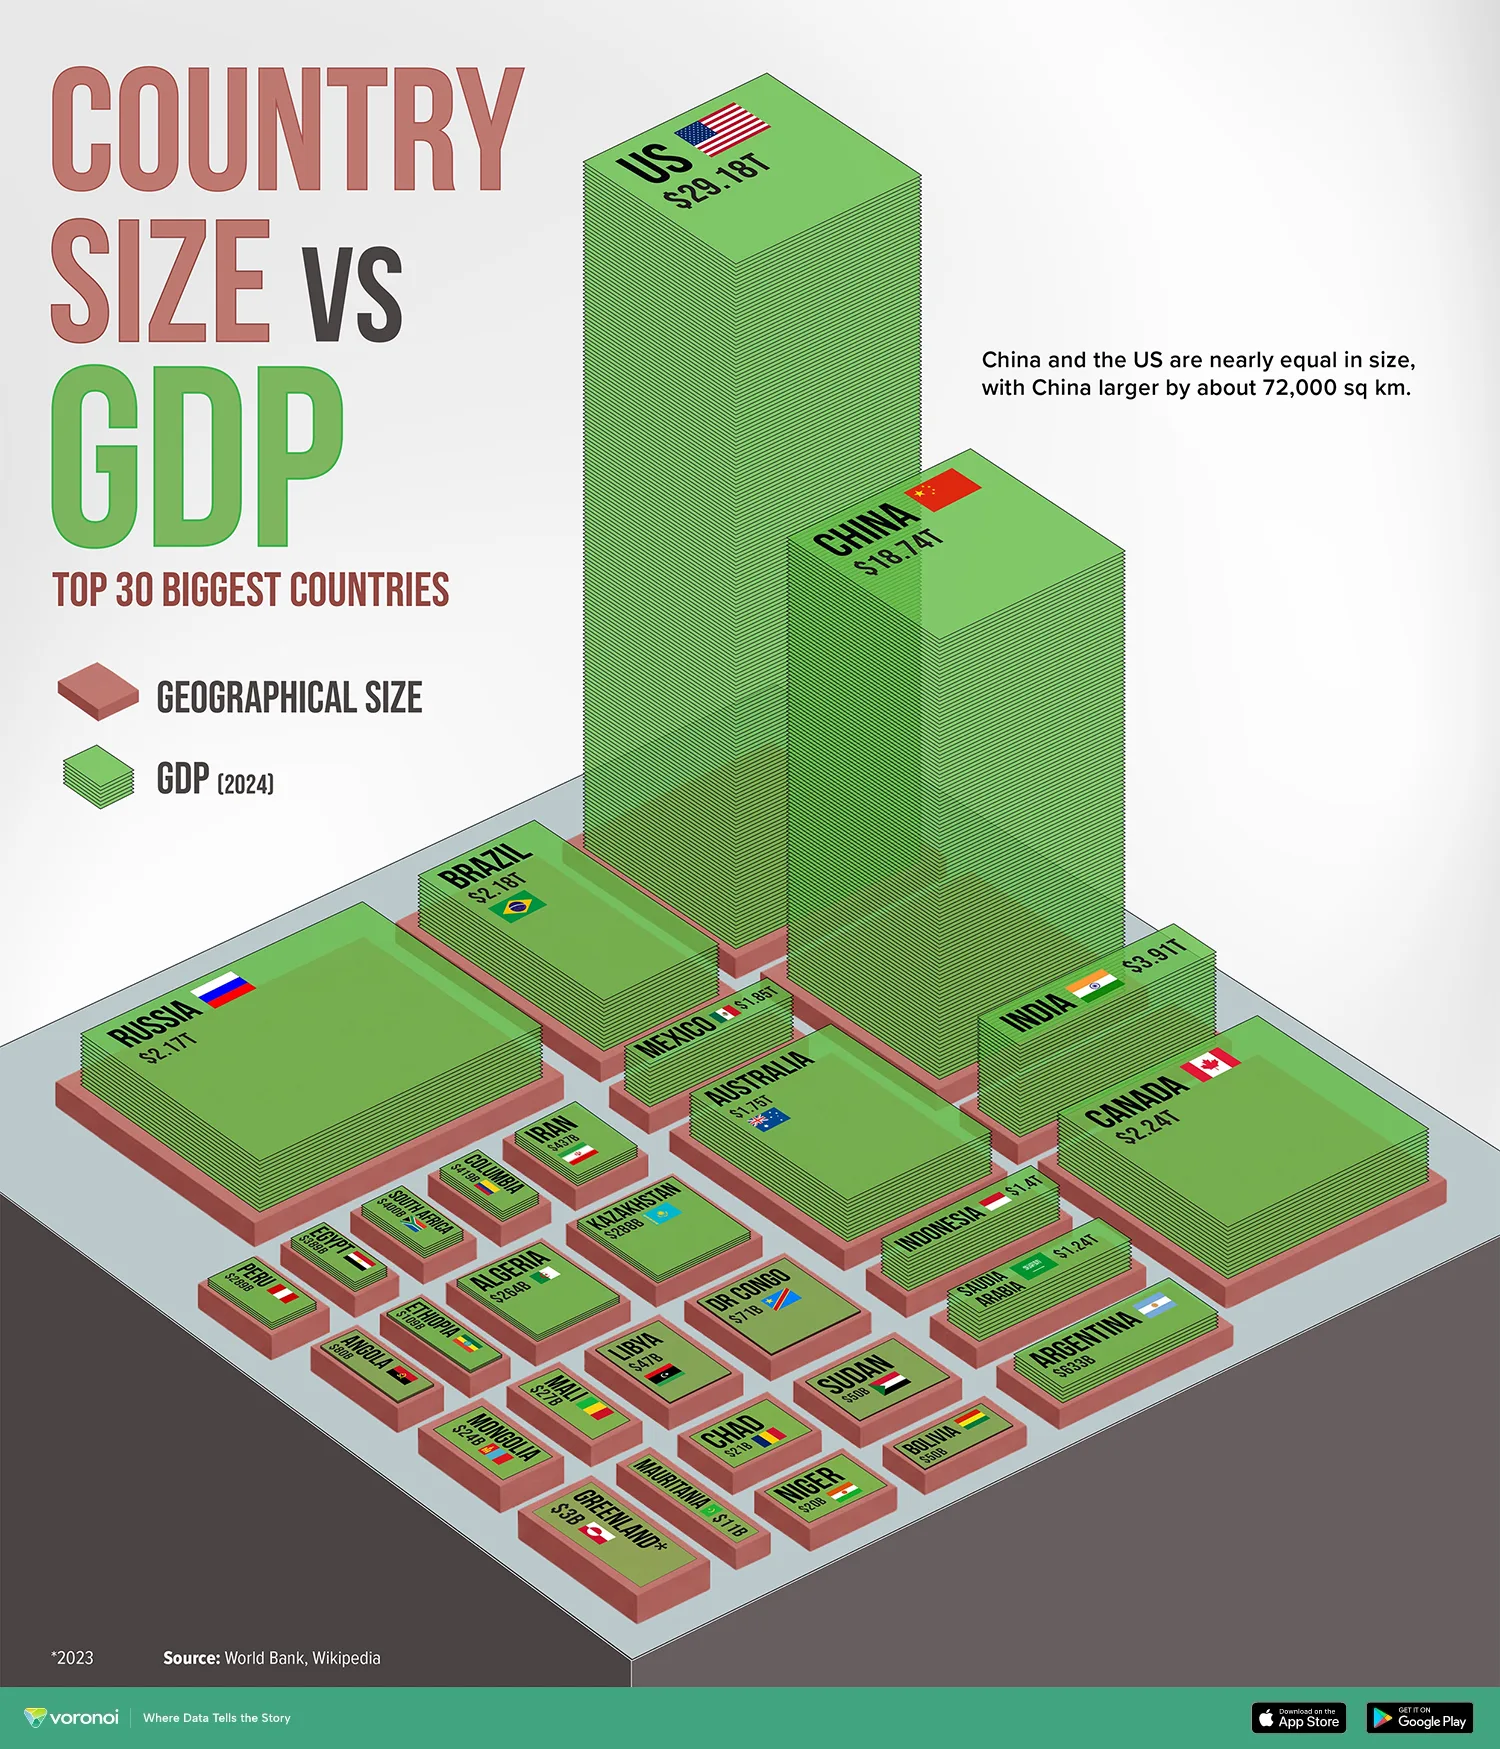
When comparing countries, two common metrics are land area and GDP. But how closely are they actually related?

This visualization, created by Julie Peasley, juxtaposes the land area and economic output of the 30 largest countries in the world. It draws from World Bank GDP data and Wikipedia’s country size estimates, offering a unique look at just how different these measures can be.

Here’s the full data used in the visualization:

30 Largest Countries
GDP ($USD)
Area (square km)
Area (square miles)
United States 29,184,890,000,000 9,525,067 3,677,649
China 18,743,803,170,827 9,596,960 3,705,407
India 3,912,686,168,582 3,287,263 1,269,219
Canada 2,241,253,230,970 9,984,670 3,855,103
Brazil 2,179,412,080,829 8,510,346 3,285,863
Russia 2,173,835,806,672 17,098,246 6,601,670
Mexico 1,852,722,885,258 1,964,375 758,449
Australia 1,752,193,307,380 7,741,220 2,988,902
Indonesia 1,396,300,098,191 1,904,569 7,35,358
Saudi Arabia 1,237,529,866,667 2,149,690 830,000
Showing 1 to 10 of 30 entries
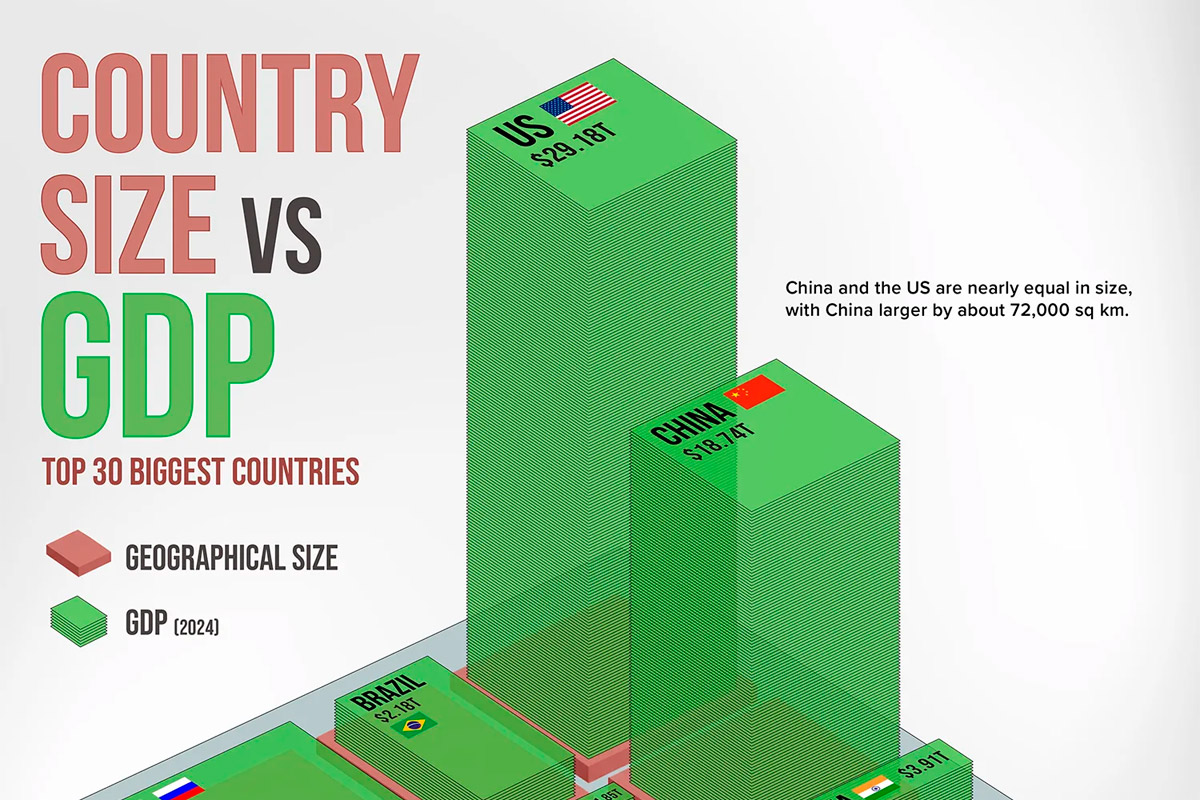
While China is slightly larger in land area than the U.S. (by about 72,000 sq. km), America’s GDP is over $10 trillion higher. Meanwhile, Russia and Canada—two of the largest countries—fall behind in economic output, illustrating the lack of a strong link between size and GDP.

Does Geographic Size Influence GDP?

Looking at this data, there’s no strong correlation between landmass and economic output. According to a 2023 research paper, GDP is more strongly influenced by population and infrastructure than sheer physical size.

For instance, India, with only a third of the U.S. or China’s landmass, ranks third in GDP due to its massive population and growing industrial base. On the flip side, Australia and Canada boast vast territories but smaller populations, limiting their economic scale.

Outliers That Punch Above Their Weight

Several countries in the visualization illustrate this dynamic vividly:

  • Japan and Germany: Relatively small in landmass but economic powerhouses, ranking high in global GDP.
  • Indonesia: The fourth most populous country, yet its GDP lags behind similarly sized countries due to development disparities.
  • Brazil: A mix of large area and moderate economic power, it sits in the middle of the pack.

As this chart shows, while landmass can support economic activity (through agriculture, resource extraction, etc.), it does not guarantee high GDP. In fact, many of the most prosperous countries are relatively small but highly industrialized and urbanized.

Información extraída de: https://www.visualcapitalist.com/cp/country-size-and-gdp/

Share
0
grafico@cosmonaut.com.co

Related posts

29 mayo, 2026

Un comienzo que preocupa más


Read more
29 mayo, 2026

La IA, un arma de poder a los ojos del Papa


Read more
29 mayo, 2026

Siempre habrá un país después del domingo


Read more

Comments are closed.

Titulo

Respuesta

TASA REAL DE RENTABILIDAD E.A. :
USTED DEBE AHORRAR PERIODICAMENTE:

Observaciones

Besta - 2020
    383 766 284